29
/
en
AIzaSyAYiBZKx7MnpbEhh9jyipgxe19OcubqV5w
April 1, 2024
150434
Honduras
HND
true
2
1
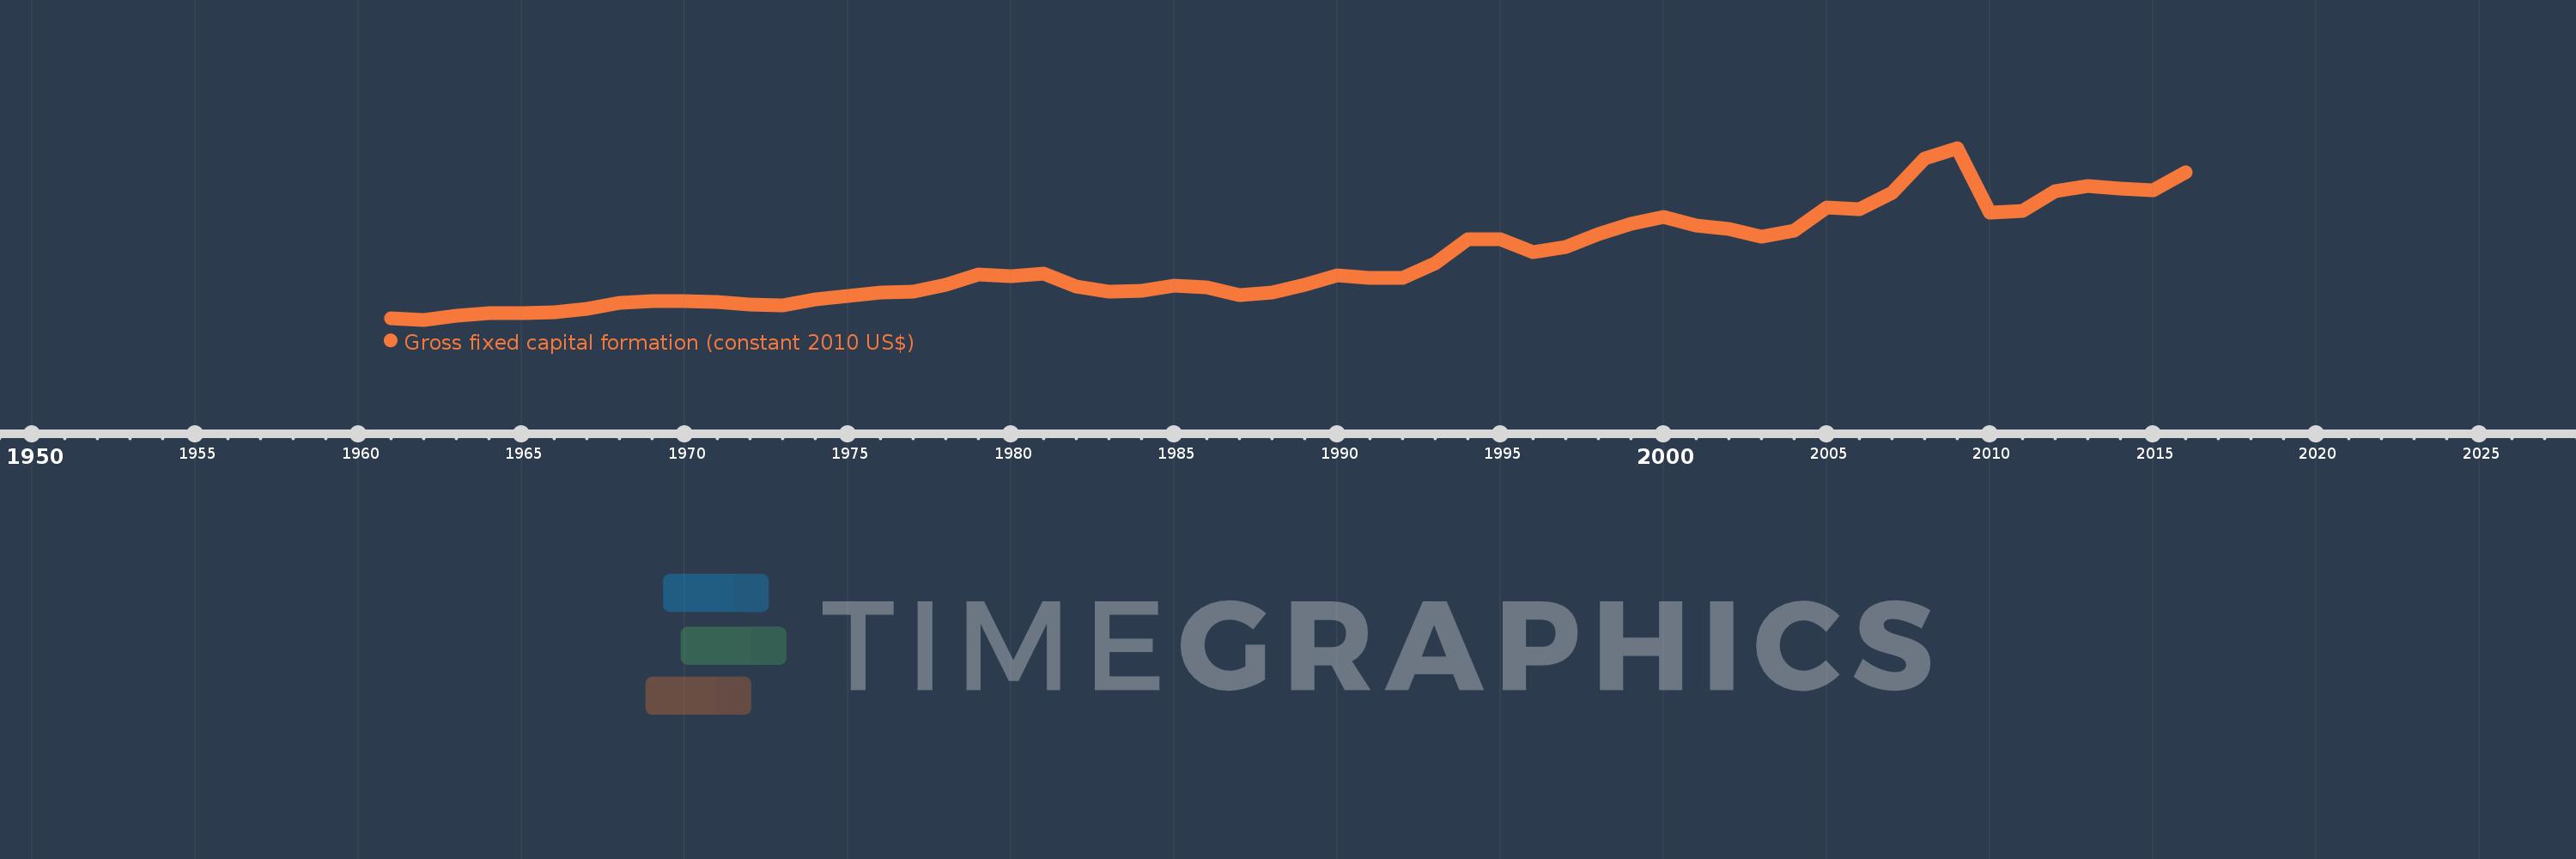
Gross fixed capital formation (constant 2010 US$)
2016,2015,2014,2013,2012,2011,2010,2009,2008,2007,2006,2005,2004,2003,2002,2001,2000,1999,1998,1997,1996,1995,1994,1993,1992,1991,1990,1989,1988,1987,1986,1985,1984,1983,1982,1981,1980,1979,1978,1977,1976,1975,1974,1973,1972,1971,1970,1969,1968,1967,1966,1965,1964,1963,1962,1961
This statistics in other country:
AfghanistanAlbaniaAlgeriaAngolaAntigua and BarbudaArab WorldArgentinaArmeniaAustraliaAustriaAzerbaijanBahamas, TheBahrainBangladeshBarbadosBelarusBelgiumBelizeBeninBermudaBhutanBoliviaBosnia and HerzegovinaBotswanaBrazilBrunei DarussalamBulgariaBurkina FasoBurundiCabo VerdeCambodiaCameroonCanadaCaribbean small statesCentral African RepublicCentral Europe and the BalticsChadChileChinaColombiaComorosCongo, Dem. Rep.Congo, Rep.Costa RicaCote d'IvoireCroatiaCubaCyprusCzech RepublicDenmarkDominicaDominican RepublicEarly-demographic dividendEast Asia & PacificEast Asia & Pacific (excluding high income)East Asia & Pacific (IDA & IBRD countries)EcuadorEgypt, Arab Rep.El SalvadorEquatorial GuineaEritreaEstoniaEuro areaEurope & Central AsiaEurope & Central Asia (excluding high income)Europe & Central Asia (IDA & IBRD countries)European UnionFinlandFragile and conflict affected situationsFranceGabonGambia, TheGeorgiaGermanyGhanaGreeceGrenadaGuatemalaGuineaGuinea-BissauGuyanaHaitiHeavily indebted poor countries (HIPC)High incomeHondurasHong Kong SAR, ChinaHungaryIBRD onlyIcelandIDA & IBRD totalIDA blendIDA onlyIDA totalIndiaIndonesiaIran, Islamic Rep.IraqIrelandIsraelItalyJamaicaJapanJordanKazakhstanKenyaKorea, Rep.KosovoKyrgyz RepublicLao PDRLate-demographic dividendLatin America & Caribbean Latin America & Caribbean (excluding high income)Latin America & the Caribbean (IDA & IBRD countries)LatviaLeast developed countries: UN classificationLebanonLiberiaLithuaniaLow & middle incomeLow incomeLower middle incomeLuxembourgMacao SAR, ChinaMacedonia, FYRMadagascarMalawiMalaysiaMaliMaltaMauritaniaMauritiusMexicoMiddle East & North AfricaMiddle East & North Africa (excluding high income)Middle East & North Africa (IDA & IBRD countries)Middle incomeMoldovaMongoliaMontenegroMoroccoMozambiqueNamibiaNepalNetherlandsNew ZealandNicaraguaNigerNigeriaNorth AmericaNorwayOECD membersOmanPakistanPanamaParaguayPeruPhilippinesPolandPortugalPost-demographic dividendPre-demographic dividendPuerto RicoRomaniaRussian FederationRwandaSaudi ArabiaSenegalSerbiaSeychellesSierra LeoneSingaporeSlovak RepublicSloveniaSouth AfricaSouth AsiaSouth Asia (IDA & IBRD)South SudanSpainSri LankaSt. Kitts and NevisSt. LuciaSt. Vincent and the GrenadinesSub-Saharan Africa Sub-Saharan Africa (excluding high income)Sub-Saharan Africa (IDA & IBRD countries)SudanSurinameSwazilandSwedenSwitzerlandTajikistanTanzaniaThailandTimor-LesteTogoTongaTrinidad and TobagoTunisiaTurkeyTurkmenistanUgandaUkraineUnited Arab EmiratesUnited KingdomUnited StatesUpper middle incomeUruguayUzbekistanVanuatuVenezuela, RBVietnamWest Bank and GazaWorldYemen, Rep.ZambiaZimbabwe Timeline:
This timeline shows a graph from 1961 to 2016 of Honduras. No data until 1960. Number of actual observations by date: 56.
Source name:
World Development Indicators
Source organization:
World Bank national accounts data, and OECD National Accounts data files.
Categories, topics:
Economy & Growth
Last updated:
apr 23, 2017
Indicators value changes by year
Minimum:
322.584 mln
jan 1, 1962
Maximum:
5.175 bln
jan 1, 2009
At the date of observation
Value
Absolute change
Change from previous value
jan 1, 1961
363.1 mln
+363.1 mln
0.0%
jan 1, 1962
322.584 mln
-40.516 mln
-11.16%
jan 1, 1963
442.759 mln
+120.175 mln
37.25%
jan 1, 1964
516.752 mln
+73.993 mln
16.71%
jan 1, 1965
512.46 mln
-4.292 mln
-0.83%
jan 1, 1966
540.101 mln
+27.641 mln
5.39%
jan 1, 1967
620.618 mln
+80.517 mln
14.91%
jan 1, 1968
810.838 mln
+190.22 mln
30.65%
jan 1, 1969
845.173 mln
+34.336 mln
4.23%
jan 1, 1970
849.809 mln
+4.635 mln
0.55%
jan 1, 1971
832.641 mln
-17.168 mln
-2.02%
jan 1, 1972
763.97 mln
-68.671 mln
-8.25%
jan 1, 1973
715.9 mln
-48.07 mln
-6.29%
jan 1, 1974
885.861 mln
+169.962 mln
23.74%
jan 1, 1975
1.004 bln
+118.458 mln
13.37%
jan 1, 1976
1.094 bln
+89.273 mln
8.89%
jan 1, 1977
1.119 bln
+25.752 mln
2.35%
jan 1, 1978
1.313 bln
+193.997 mln
17.33%
jan 1, 1979
1.6 bln
+286.703 mln
21.83%
jan 1, 1980
1.559 bln
-41.203 mln
-2.58%
jan 1, 1981
1.628 bln
+68.671 mln
4.41%
jan 1, 1982
1.267 bln
-360.525 mln
-22.15%
jan 1, 1983
1.114 bln
-152.794 mln
-12.06%
jan 1, 1984
1.133 bln
+18.885 mln
1.69%
jan 1, 1985
1.288 bln
+154.511 mln
13.64%
jan 1, 1986
1.246 bln
-41.203 mln
-3.2%
jan 1, 1987
1.015 bln
-231.766 mln
-18.6%
jan 1, 1988
1.082 bln
+66.955 mln
6.6%
jan 1, 1989
1.312 bln
+230.049 mln
21.27%
jan 1, 1990
1.579 bln
+267.819 mln
20.42%
jan 1, 1991
1.506 bln
-73.822 mln
-4.67%
jan 1, 1992
1.509 bln
+3.434 mln
0.23%
jan 1, 1993
1.916 bln
+406.878 mln
26.96%
jan 1, 1994
2.603 bln
+686.714 mln
35.84%
jan 1, 1995
2.599 bln
-3.434 mln
-0.13%
jan 1, 1996
2.225 bln
-374.259 mln
-14.4%
jan 1, 1997
2.366 bln
+140.776 mln
6.33%
jan 1, 1998
2.74 bln
+374.259 mln
15.82%
jan 1, 1999
3.023 bln
+283.27 mln
10.34%
jan 1, 2000
3.221 bln
+197.43 mln
6.53%
jan 1, 2001
2.975 bln
-245.5 mln
-7.62%
jan 1, 2002
2.886 bln
-89.546 mln
-3.01%
jan 1, 2003
2.675 bln
-210.177 mln
-7.28%
jan 1, 2004
2.841 bln
+165.55 mln
6.19%
jan 1, 2005
3.505 bln
+664.02 mln
23.37%
jan 1, 2006
3.455 bln
-50.255 mln
-1.43%
jan 1, 2007
3.916 bln
+461.366 mln
13.35%
jan 1, 2008
4.87 bln
+954.348 mln
24.37%
jan 1, 2009
5.175 bln
+304.81 mln
6.26%
jan 1, 2010
3.344 bln
-1.831 bln
-35.39%
jan 1, 2011
3.391 bln
+46.705 mln
1.4%
jan 1, 2012
3.963 bln
+572.407 mln
16.88%
jan 1, 2013
4.111 bln
+147.648 mln
3.73%
jan 1, 2014
4.032 bln
-78.689 mln
-1.91%
jan 1, 2015
3.974 bln
-58.297 mln
-1.45%
jan 1, 2016
4.482 bln
+508.081 mln
12.79%
Ranking of countries by current statistics by years


Comments: