29
/
en
AIzaSyAYiBZKx7MnpbEhh9jyipgxe19OcubqV5w
April 1, 2024
262305
Thailand
THA
true
2
1
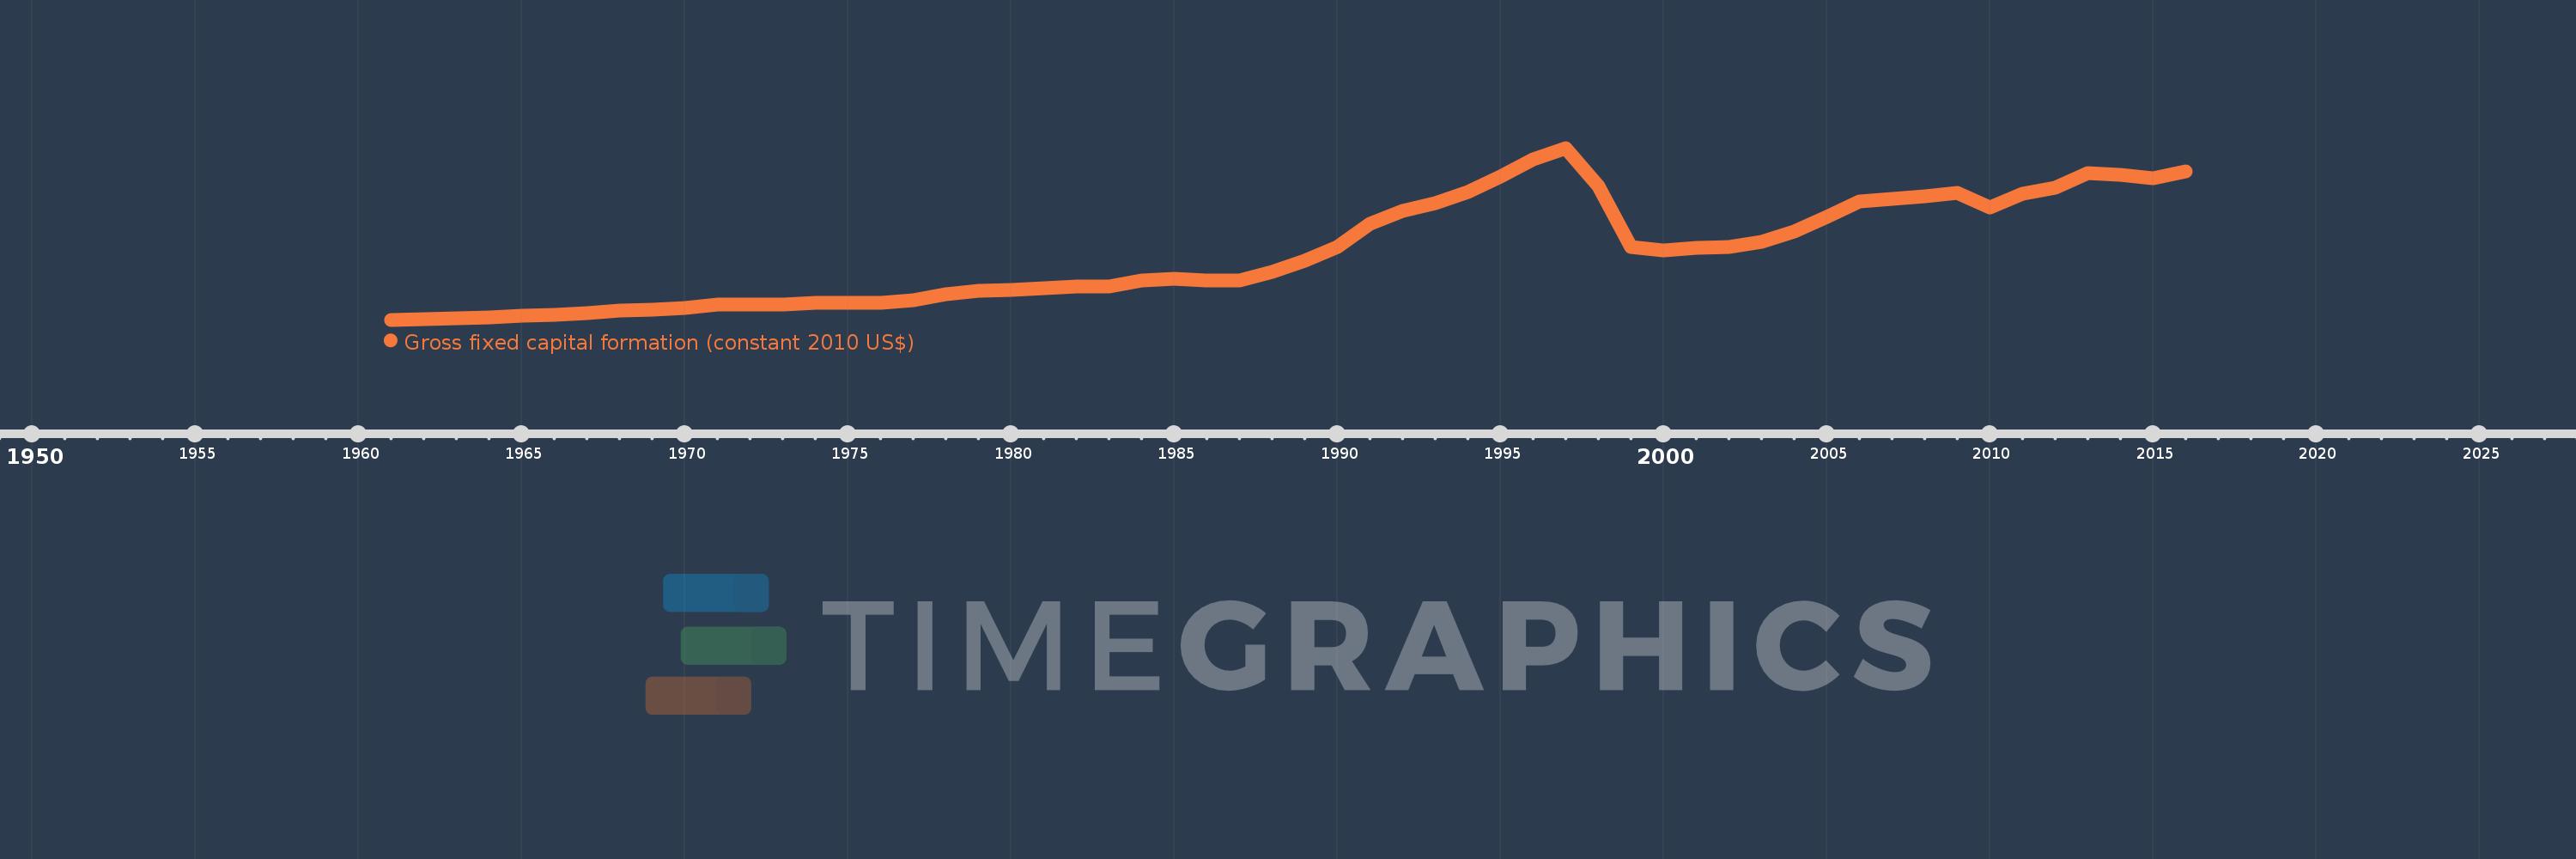
Gross fixed capital formation (constant 2010 US$)
2016,2015,2014,2013,2012,2011,2010,2009,2008,2007,2006,2005,2004,2003,2002,2001,2000,1999,1998,1997,1996,1995,1994,1993,1992,1991,1990,1989,1988,1987,1986,1985,1984,1983,1982,1981,1980,1979,1978,1977,1976,1975,1974,1973,1972,1971,1970,1969,1968,1967,1966,1965,1964,1963,1962,1961
This statistics in other country:
AfghanistanAlbaniaAlgeriaAngolaAntigua and BarbudaArab WorldArgentinaArmeniaAustraliaAustriaAzerbaijanBahamas, TheBahrainBangladeshBarbadosBelarusBelgiumBelizeBeninBermudaBhutanBoliviaBosnia and HerzegovinaBotswanaBrazilBrunei DarussalamBulgariaBurkina FasoBurundiCabo VerdeCambodiaCameroonCanadaCaribbean small statesCentral African RepublicCentral Europe and the BalticsChadChileChinaColombiaComorosCongo, Dem. Rep.Congo, Rep.Costa RicaCote d'IvoireCroatiaCubaCyprusCzech RepublicDenmarkDominicaDominican RepublicEarly-demographic dividendEast Asia & PacificEast Asia & Pacific (excluding high income)East Asia & Pacific (IDA & IBRD countries)EcuadorEgypt, Arab Rep.El SalvadorEquatorial GuineaEritreaEstoniaEuro areaEurope & Central AsiaEurope & Central Asia (excluding high income)Europe & Central Asia (IDA & IBRD countries)European UnionFinlandFragile and conflict affected situationsFranceGabonGambia, TheGeorgiaGermanyGhanaGreeceGrenadaGuatemalaGuineaGuinea-BissauGuyanaHaitiHeavily indebted poor countries (HIPC)High incomeHondurasHong Kong SAR, ChinaHungaryIBRD onlyIcelandIDA & IBRD totalIDA blendIDA onlyIDA totalIndiaIndonesiaIran, Islamic Rep.IraqIrelandIsraelItalyJamaicaJapanJordanKazakhstanKenyaKorea, Rep.KosovoKyrgyz RepublicLao PDRLate-demographic dividendLatin America & Caribbean Latin America & Caribbean (excluding high income)Latin America & the Caribbean (IDA & IBRD countries)LatviaLeast developed countries: UN classificationLebanonLiberiaLithuaniaLow & middle incomeLow incomeLower middle incomeLuxembourgMacao SAR, ChinaMacedonia, FYRMadagascarMalawiMalaysiaMaliMaltaMauritaniaMauritiusMexicoMiddle East & North AfricaMiddle East & North Africa (excluding high income)Middle East & North Africa (IDA & IBRD countries)Middle incomeMoldovaMongoliaMontenegroMoroccoMozambiqueNamibiaNepalNetherlandsNew ZealandNicaraguaNigerNigeriaNorth AmericaNorwayOECD membersOmanPakistanPanamaParaguayPeruPhilippinesPolandPortugalPost-demographic dividendPre-demographic dividendPuerto RicoRomaniaRussian FederationRwandaSaudi ArabiaSenegalSerbiaSeychellesSierra LeoneSingaporeSlovak RepublicSloveniaSouth AfricaSouth AsiaSouth Asia (IDA & IBRD)South SudanSpainSri LankaSt. Kitts and NevisSt. LuciaSt. Vincent and the GrenadinesSub-Saharan Africa Sub-Saharan Africa (excluding high income)Sub-Saharan Africa (IDA & IBRD countries)SudanSurinameSwazilandSwedenSwitzerlandTajikistanTanzaniaThailandTimor-LesteTogoTongaTrinidad and TobagoTunisiaTurkeyTurkmenistanUgandaUkraineUnited Arab EmiratesUnited KingdomUnited StatesUpper middle incomeUruguayUzbekistanVanuatuVenezuela, RBVietnamWest Bank and GazaWorldYemen, Rep.ZambiaZimbabwe Timeline:
This timeline shows a graph from 1961 to 2016 of Thailand. No data until 1960. Number of actual observations by date: 56.
Source name:
World Development Indicators
Source organization:
World Bank national accounts data, and OECD National Accounts data files.
Categories, topics:
Economy & Growth
Last updated:
apr 23, 2017
Indicators value changes by year
Minimum:
2.814 bln
jan 1, 1961
Maximum:
110.759 bln
jan 1, 1997
At the date of observation
Value
Absolute change
Change from previous value
jan 1, 1961
2.814 bln
+2.814 bln
0.0%
jan 1, 1962
2.995 bln
+181.541 mln
6.45%
jan 1, 1963
3.54 bln
+544.616 mln
18.18%
jan 1, 1964
4.206 bln
+665.654 mln
18.8%
jan 1, 1965
5.174 bln
+968.217 mln
23.02%
jan 1, 1966
5.628 bln
+453.841 mln
8.77%
jan 1, 1967
6.868 bln
+1.241 bln
22.04%
jan 1, 1968
8.472 bln
+1.604 bln
23.35%
jan 1, 1969
9.198 bln
+726.198 mln
8.57%
jan 1, 1970
10.318 bln
+1.119 bln
12.17%
jan 1, 1971
12.101 bln
+1.784 bln
17.29%
jan 1, 1972
12.165 bln
+63.538 mln
0.53%
jan 1, 1973
12.26 bln
+95.307 mln
0.78%
jan 1, 1974
13.499 bln
+1.239 bln
10.1%
jan 1, 1975
13.467 bln
-31.769 mln
-0.24%
jan 1, 1976
13.372 bln
-95.307 mln
-0.71%
jan 1, 1977
15.118 bln
+1.747 bln
13.06%
jan 1, 1978
18.739 bln
+3.621 bln
23.95%
jan 1, 1979
20.804 bln
+2.064 bln
11.02%
jan 1, 1980
21.63 bln
+825.747 mln
3.97%
jan 1, 1981
22.424 bln
+794.061 mln
3.67%
jan 1, 1982
23.883 bln
+1.459 bln
6.51%
jan 1, 1983
23.767 bln
-115.267 mln
-0.48%
jan 1, 1984
27.229 bln
+3.462 bln
14.57%
jan 1, 1985
28.829 bln
+1.6 bln
5.87%
jan 1, 1986
27.748 bln
-1.081 bln
-3.75%
jan 1, 1987
27.557 bln
-190.531 mln
-0.69%
jan 1, 1988
32.635 bln
+5.078 bln
18.43%
jan 1, 1989
39.797 bln
+7.163 bln
21.95%
jan 1, 1990
48.761 bln
+8.964 bln
22.52%
jan 1, 1991
63.195 bln
+14.433 bln
29.6%
jan 1, 1992
71.208 bln
+8.014 bln
12.68%
jan 1, 1993
75.934 bln
+4.726 bln
6.64%
jan 1, 1994
82.978 bln
+7.044 bln
9.28%
jan 1, 1995
92.542 bln
+9.564 bln
11.53%
jan 1, 1996
103.527 bln
+10.985 bln
11.87%
jan 1, 1997
110.759 bln
+7.233 bln
6.99%
jan 1, 1998
86.625 bln
-24.134 bln
-21.79%
jan 1, 1999
48.487 bln
-38.138 bln
-44.03%
jan 1, 2000
46.311 bln
-2.177 bln
-4.49%
jan 1, 2001
47.742 bln
+1.432 bln
3.09%
jan 1, 2002
48.618 bln
+876.038 mln
1.83%
jan 1, 2003
51.629 bln
+3.011 bln
6.19%
jan 1, 2004
58.154 bln
+6.525 bln
12.64%
jan 1, 2005
67.38 bln
+9.226 bln
15.86%
jan 1, 2006
77.002 bln
+9.621 bln
14.28%
jan 1, 2007
79.014 bln
+2.012 bln
2.61%
jan 1, 2008
80.4 bln
+1.387 bln
1.75%
jan 1, 2009
82.278 bln
+1.878 bln
2.34%
jan 1, 2010
73.334 bln
-8.944 bln
-10.87%
jan 1, 2011
81.84 bln
+8.506 bln
11.6%
jan 1, 2012
85.825 bln
+3.985 bln
4.87%
jan 1, 2013
95.02 bln
+9.194 bln
10.71%
jan 1, 2014
94.076 bln
-943.912 mln
-0.99%
jan 1, 2015
91.826 bln
-2.249 bln
-2.39%
jan 1, 2016
96.152 bln
+4.326 bln
4.71%
Ranking of countries by current statistics by years


Comments: