29
/
en
AIzaSyAYiBZKx7MnpbEhh9jyipgxe19OcubqV5w
April 1, 2024
266900
Trinidad and Tobago
TTO
true
2
1
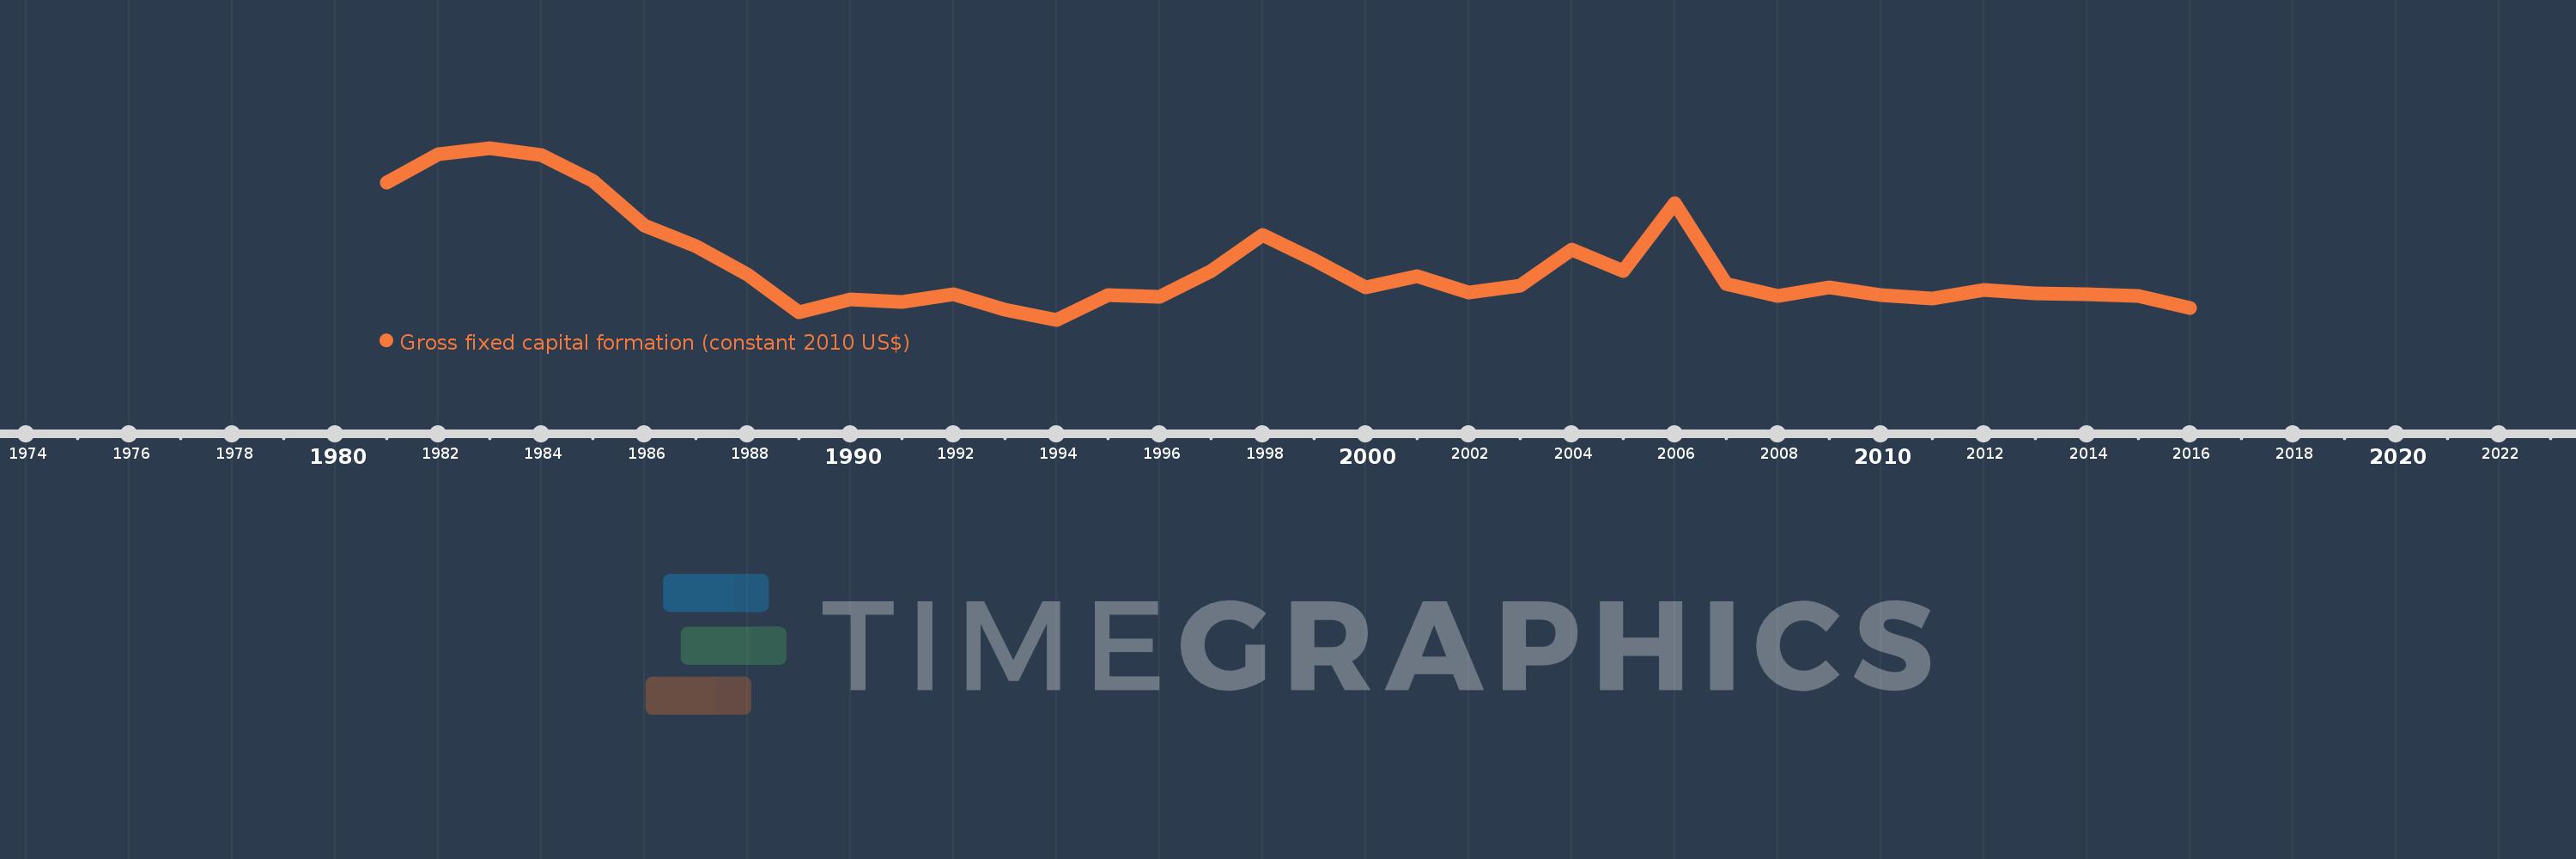
Gross fixed capital formation (constant 2010 US$)
2016,2015,2014,2013,2012,2011,2010,2009,2008,2007,2006,2005,2004,2003,2002,2001,2000,1999,1998,1997,1996,1995,1994,1993,1992,1991,1990,1989,1988,1987,1986,1985,1984,1983,1982,1981
This statistics in other country:
AfghanistanAlbaniaAlgeriaAngolaAntigua and BarbudaArab WorldArgentinaArmeniaAustraliaAustriaAzerbaijanBahamas, TheBahrainBangladeshBarbadosBelarusBelgiumBelizeBeninBermudaBhutanBoliviaBosnia and HerzegovinaBotswanaBrazilBrunei DarussalamBulgariaBurkina FasoBurundiCabo VerdeCambodiaCameroonCanadaCaribbean small statesCentral African RepublicCentral Europe and the BalticsChadChileChinaColombiaComorosCongo, Dem. Rep.Congo, Rep.Costa RicaCote d'IvoireCroatiaCubaCyprusCzech RepublicDenmarkDominicaDominican RepublicEarly-demographic dividendEast Asia & PacificEast Asia & Pacific (excluding high income)East Asia & Pacific (IDA & IBRD countries)EcuadorEgypt, Arab Rep.El SalvadorEquatorial GuineaEritreaEstoniaEuro areaEurope & Central AsiaEurope & Central Asia (excluding high income)Europe & Central Asia (IDA & IBRD countries)European UnionFinlandFragile and conflict affected situationsFranceGabonGambia, TheGeorgiaGermanyGhanaGreeceGrenadaGuatemalaGuineaGuinea-BissauGuyanaHaitiHeavily indebted poor countries (HIPC)High incomeHondurasHong Kong SAR, ChinaHungaryIBRD onlyIcelandIDA & IBRD totalIDA blendIDA onlyIDA totalIndiaIndonesiaIran, Islamic Rep.IraqIrelandIsraelItalyJamaicaJapanJordanKazakhstanKenyaKorea, Rep.KosovoKyrgyz RepublicLao PDRLate-demographic dividendLatin America & Caribbean Latin America & Caribbean (excluding high income)Latin America & the Caribbean (IDA & IBRD countries)LatviaLeast developed countries: UN classificationLebanonLiberiaLithuaniaLow & middle incomeLow incomeLower middle incomeLuxembourgMacao SAR, ChinaMacedonia, FYRMadagascarMalawiMalaysiaMaliMaltaMauritaniaMauritiusMexicoMiddle East & North AfricaMiddle East & North Africa (excluding high income)Middle East & North Africa (IDA & IBRD countries)Middle incomeMoldovaMongoliaMontenegroMoroccoMozambiqueNamibiaNepalNetherlandsNew ZealandNicaraguaNigerNigeriaNorth AmericaNorwayOECD membersOmanPakistanPanamaParaguayPeruPhilippinesPolandPortugalPost-demographic dividendPre-demographic dividendPuerto RicoRomaniaRussian FederationRwandaSaudi ArabiaSenegalSerbiaSeychellesSierra LeoneSingaporeSlovak RepublicSloveniaSouth AfricaSouth AsiaSouth Asia (IDA & IBRD)South SudanSpainSri LankaSt. Kitts and NevisSt. LuciaSt. Vincent and the GrenadinesSub-Saharan Africa Sub-Saharan Africa (excluding high income)Sub-Saharan Africa (IDA & IBRD countries)SudanSurinameSwazilandSwedenSwitzerlandTajikistanTanzaniaThailandTimor-LesteTogoTongaTrinidad and TobagoTunisiaTurkeyTurkmenistanUgandaUkraineUnited Arab EmiratesUnited KingdomUnited StatesUpper middle incomeUruguayUzbekistanVanuatuVenezuela, RBVietnamWest Bank and GazaWorldYemen, Rep.ZambiaZimbabwe Timeline:
This timeline shows a graph from 1981 to 2016 of Trinidad and Tobago. No data until 1980. Number of actual observations by date: 36.
Source name:
World Development Indicators
Source organization:
World Bank national accounts data, and OECD National Accounts data files.
Categories, topics:
Economy & Growth
Last updated:
apr 23, 2017
Indicators value changes by year
Minimum:
2.249 bln
jan 1, 1994
Maximum:
8.061 bln
jan 1, 1983
At the date of observation
Value
Absolute change
Change from previous value
jan 1, 1981
6.898 bln
+6.898 bln
0.0%
jan 1, 1982
7.854 bln
+955.716 mln
13.85%
jan 1, 1983
8.061 bln
+206.93 mln
2.63%
jan 1, 1984
7.822 bln
-238.929 mln
-2.96%
jan 1, 1985
6.94 bln
-881.477 mln
-11.27%
jan 1, 1986
5.427 bln
-1.513 bln
-21.8%
jan 1, 1987
4.751 bln
-675.828 mln
-12.45%
jan 1, 1988
3.783 bln
-968.089 mln
-20.38%
jan 1, 1989
2.494 bln
-1.289 bln
-34.08%
jan 1, 1990
2.952 bln
+458.658 mln
18.39%
jan 1, 1991
2.864 bln
-88.318 mln
-2.99%
jan 1, 1992
3.113 bln
+249.169 mln
8.7%
jan 1, 1993
2.595 bln
-518.817 mln
-16.66%
jan 1, 1994
2.249 bln
-345.167 mln
-13.3%
jan 1, 1995
3.078 bln
+828.571 mln
36.84%
jan 1, 1996
3.019 bln
-58.786 mln
-1.91%
jan 1, 1997
3.909 bln
+889.588 mln
29.47%
jan 1, 1998
5.122 bln
+1.213 bln
31.04%
jan 1, 1999
4.286 bln
-835.66 mln
-16.31%
jan 1, 2000
3.35 bln
-936.769 mln
-21.85%
jan 1, 2001
3.731 bln
+381.728 mln
11.4%
jan 1, 2002
3.184 bln
-547.768 mln
-14.68%
jan 1, 2003
3.398 bln
+214.768 mln
6.75%
jan 1, 2004
4.615 bln
+1.217 bln
35.81%
jan 1, 2005
3.889 bln
-726.261 mln
-15.74%
jan 1, 2006
6.184 bln
+2.295 bln
59.0%
jan 1, 2007
3.452 bln
-2.732 bln
-44.18%
jan 1, 2008
3.055 bln
-396.8 mln
-11.5%
jan 1, 2009
3.358 bln
+302.969 mln
9.92%
jan 1, 2010
3.089 bln
-268.924 mln
-8.01%
jan 1, 2011
2.97 bln
-119.467 mln
-3.87%
jan 1, 2012
3.268 bln
+298.973 mln
10.07%
jan 1, 2013
3.155 bln
-113.718 mln
-3.48%
jan 1, 2014
3.11 bln
-44.317 mln
-1.4%
jan 1, 2015
3.052 bln
-58.358 mln
-1.88%
jan 1, 2016
2.655 bln
-397.52 mln
-13.02%
Ranking of countries by current statistics by years


Comments: