29
/
en
AIzaSyAYiBZKx7MnpbEhh9jyipgxe19OcubqV5w
April 1, 2024
82842
Belize
BLZ
true
2
1
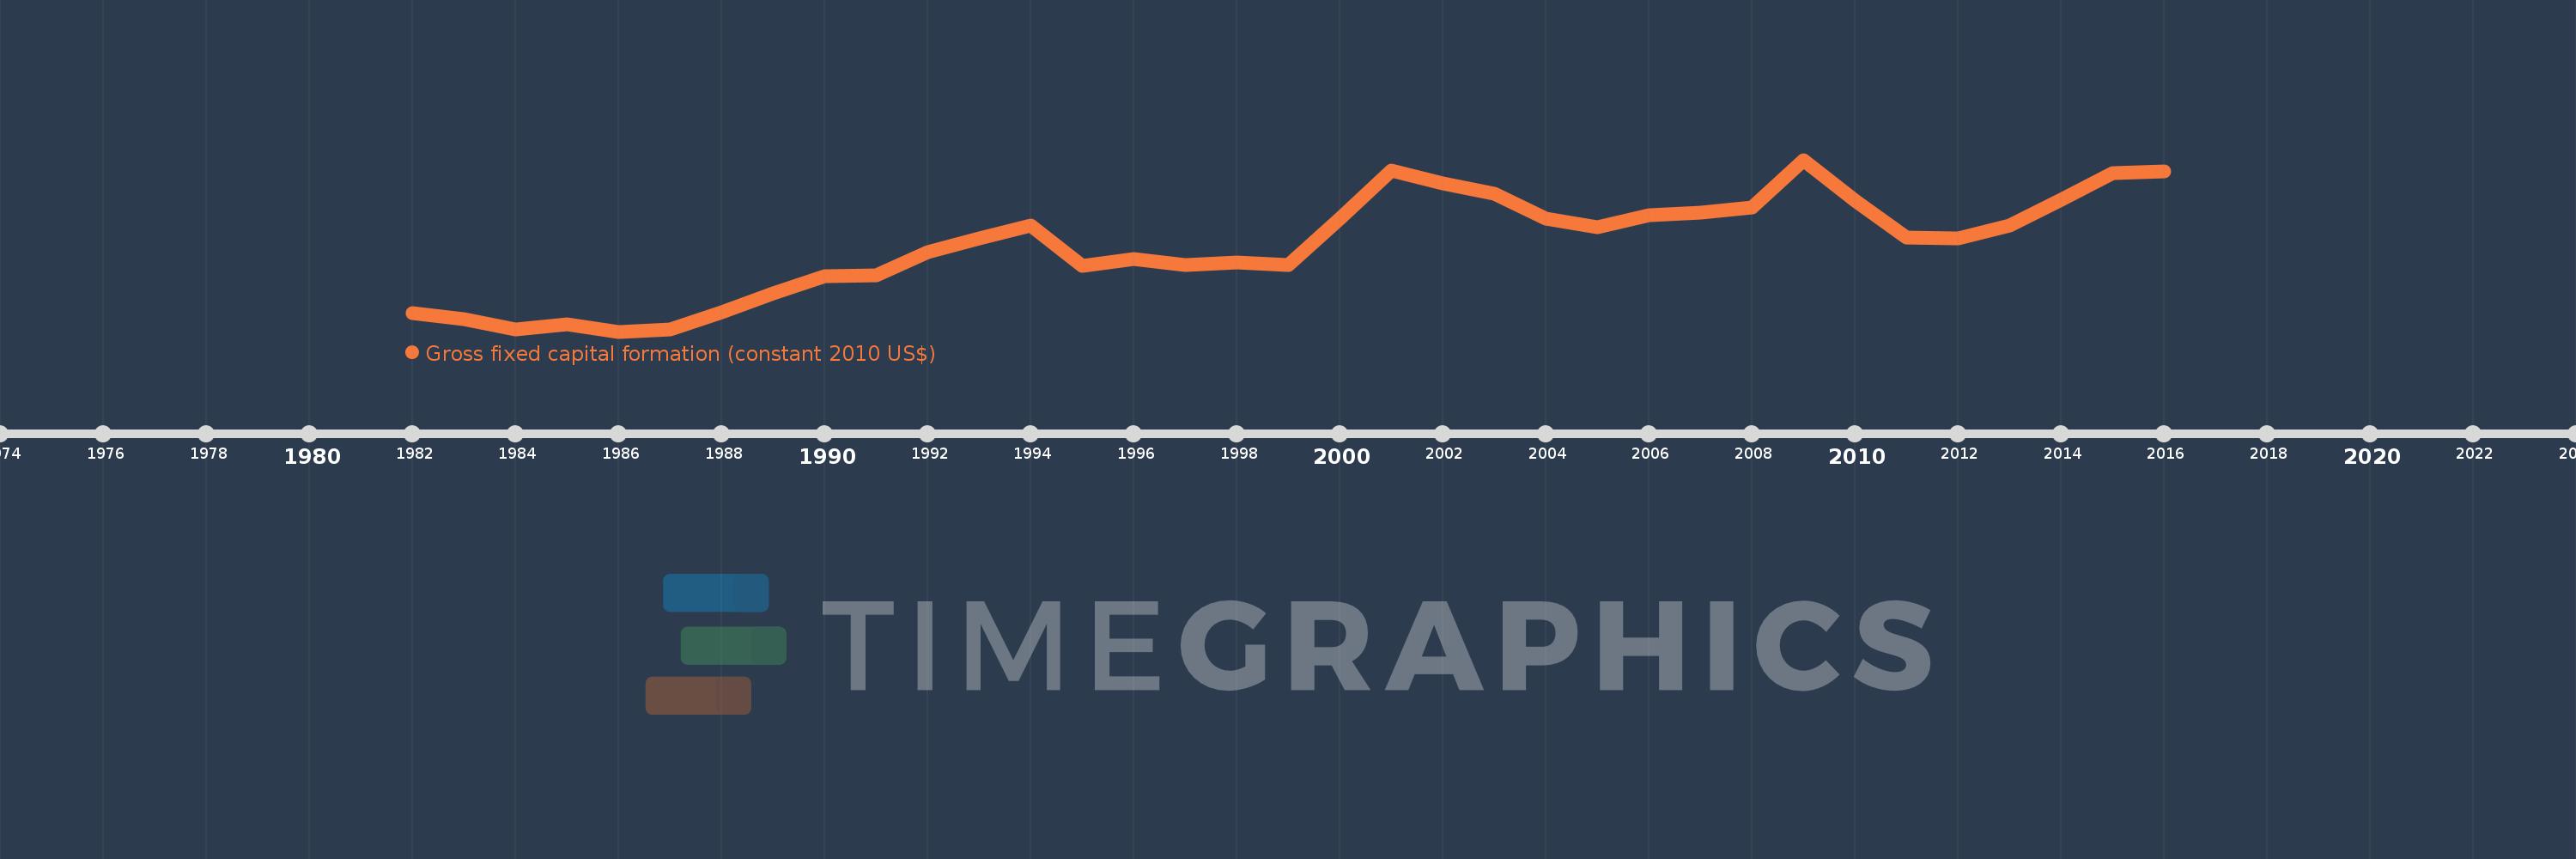
Gross fixed capital formation (constant 2010 US$)
2016,2015,2014,2013,2012,2011,2010,2009,2008,2007,2006,2005,2004,2003,2002,2001,2000,1999,1998,1997,1996,1995,1994,1993,1992,1991,1990,1989,1988,1987,1986,1985,1984,1983,1982
This statistics in other country:
AfghanistanAlbaniaAlgeriaAngolaAntigua and BarbudaArab WorldArgentinaArmeniaAustraliaAustriaAzerbaijanBahamas, TheBahrainBangladeshBarbadosBelarusBelgiumBelizeBeninBermudaBhutanBoliviaBosnia and HerzegovinaBotswanaBrazilBrunei DarussalamBulgariaBurkina FasoBurundiCabo VerdeCambodiaCameroonCanadaCaribbean small statesCentral African RepublicCentral Europe and the BalticsChadChileChinaColombiaComorosCongo, Dem. Rep.Congo, Rep.Costa RicaCote d'IvoireCroatiaCubaCyprusCzech RepublicDenmarkDominicaDominican RepublicEarly-demographic dividendEast Asia & PacificEast Asia & Pacific (excluding high income)East Asia & Pacific (IDA & IBRD countries)EcuadorEgypt, Arab Rep.El SalvadorEquatorial GuineaEritreaEstoniaEuro areaEurope & Central AsiaEurope & Central Asia (excluding high income)Europe & Central Asia (IDA & IBRD countries)European UnionFinlandFragile and conflict affected situationsFranceGabonGambia, TheGeorgiaGermanyGhanaGreeceGrenadaGuatemalaGuineaGuinea-BissauGuyanaHaitiHeavily indebted poor countries (HIPC)High incomeHondurasHong Kong SAR, ChinaHungaryIBRD onlyIcelandIDA & IBRD totalIDA blendIDA onlyIDA totalIndiaIndonesiaIran, Islamic Rep.IraqIrelandIsraelItalyJamaicaJapanJordanKazakhstanKenyaKorea, Rep.KosovoKyrgyz RepublicLao PDRLate-demographic dividendLatin America & Caribbean Latin America & Caribbean (excluding high income)Latin America & the Caribbean (IDA & IBRD countries)LatviaLeast developed countries: UN classificationLebanonLiberiaLithuaniaLow & middle incomeLow incomeLower middle incomeLuxembourgMacao SAR, ChinaMacedonia, FYRMadagascarMalawiMalaysiaMaliMaltaMauritaniaMauritiusMexicoMiddle East & North AfricaMiddle East & North Africa (excluding high income)Middle East & North Africa (IDA & IBRD countries)Middle incomeMoldovaMongoliaMontenegroMoroccoMozambiqueNamibiaNepalNetherlandsNew ZealandNicaraguaNigerNigeriaNorth AmericaNorwayOECD membersOmanPakistanPanamaParaguayPeruPhilippinesPolandPortugalPost-demographic dividendPre-demographic dividendPuerto RicoRomaniaRussian FederationRwandaSaudi ArabiaSenegalSerbiaSeychellesSierra LeoneSingaporeSlovak RepublicSloveniaSouth AfricaSouth AsiaSouth Asia (IDA & IBRD)South SudanSpainSri LankaSt. Kitts and NevisSt. LuciaSt. Vincent and the GrenadinesSub-Saharan Africa Sub-Saharan Africa (excluding high income)Sub-Saharan Africa (IDA & IBRD countries)SudanSurinameSwazilandSwedenSwitzerlandTajikistanTanzaniaThailandTimor-LesteTogoTongaTrinidad and TobagoTunisiaTurkeyTurkmenistanUgandaUkraineUnited Arab EmiratesUnited KingdomUnited StatesUpper middle incomeUruguayUzbekistanVanuatuVenezuela, RBVietnamWest Bank and GazaWorldYemen, Rep.ZambiaZimbabwe Timeline:
This timeline shows a graph from 1982 to 2016 of Belize. No data until 1981. Number of actual observations by date: 35.
Source name:
World Development Indicators
Source organization:
World Bank national accounts data, and OECD National Accounts data files.
Categories, topics:
Economy & Growth
Last updated:
apr 23, 2017
Indicators value changes by year
Minimum:
68.254 mln
jan 1, 1986
Maximum:
334.004 mln
jan 1, 2009
At the date of observation
Value
Absolute change
Change from previous value
jan 1, 1982
96.744 mln
+96.744 mln
0.0%
jan 1, 1983
87.744 mln
-9.0 mln
-9.3%
jan 1, 1984
72.089 mln
-15.656 mln
-17.84%
jan 1, 1985
78.949 mln
+6.861 mln
9.52%
jan 1, 1986
68.254 mln
-10.695 mln
-13.55%
jan 1, 1987
71.647 mln
+3.392 mln
4.97%
jan 1, 1988
98.104 mln
+26.457 mln
36.93%
jan 1, 1989
128.022 mln
+29.918 mln
30.5%
jan 1, 1990
154.445 mln
+26.423 mln
20.64%
jan 1, 1991
155.886 mln
+1.441 mln
0.93%
jan 1, 1992
191.376 mln
+35.49 mln
22.77%
jan 1, 1993
212.804 mln
+21.428 mln
11.2%
jan 1, 1994
232.239 mln
+19.435 mln
9.13%
jan 1, 1995
169.952 mln
-62.287 mln
-26.82%
jan 1, 1996
181.163 mln
+11.211 mln
6.6%
jan 1, 1997
171.514 mln
-9.65 mln
-5.33%
jan 1, 1998
174.574 mln
+3.06 mln
1.78%
jan 1, 1999
170.571 mln
-4.003 mln
-2.29%
jan 1, 2000
242.325 mln
+71.754 mln
42.07%
jan 1, 2001
317.9 mln
+75.575 mln
31.19%
jan 1, 2002
298.043 mln
-19.857 mln
-6.25%
jan 1, 2003
282.114 mln
-15.929 mln
-5.34%
jan 1, 2004
242.586 mln
-39.528 mln
-14.01%
jan 1, 2005
229.509 mln
-13.077 mln
-5.39%
jan 1, 2006
247.966 mln
+18.456 mln
8.04%
jan 1, 2007
252.389 mln
+4.424 mln
1.78%
jan 1, 2008
260.618 mln
+8.229 mln
3.26%
jan 1, 2009
334.004 mln
+73.386 mln
28.16%
jan 1, 2010
271.124 mln
-62.88 mln
-18.83%
jan 1, 2011
213.622 mln
-57.502 mln
-21.21%
jan 1, 2012
212.559 mln
-1.063 mln
-0.5%
jan 1, 2013
232.479 mln
+19.92 mln
9.37%
jan 1, 2014
272.525 mln
+40.046 mln
17.23%
jan 1, 2015
313.424 mln
+40.899 mln
15.01%
jan 1, 2016
316.698 mln
+3.274 mln
1.04%
Ranking of countries by current statistics by years


Comments: