29
/
en
AIzaSyAYiBZKx7MnpbEhh9jyipgxe19OcubqV5w
April 1, 2024
209375
New Zealand
NZL
true
2
1
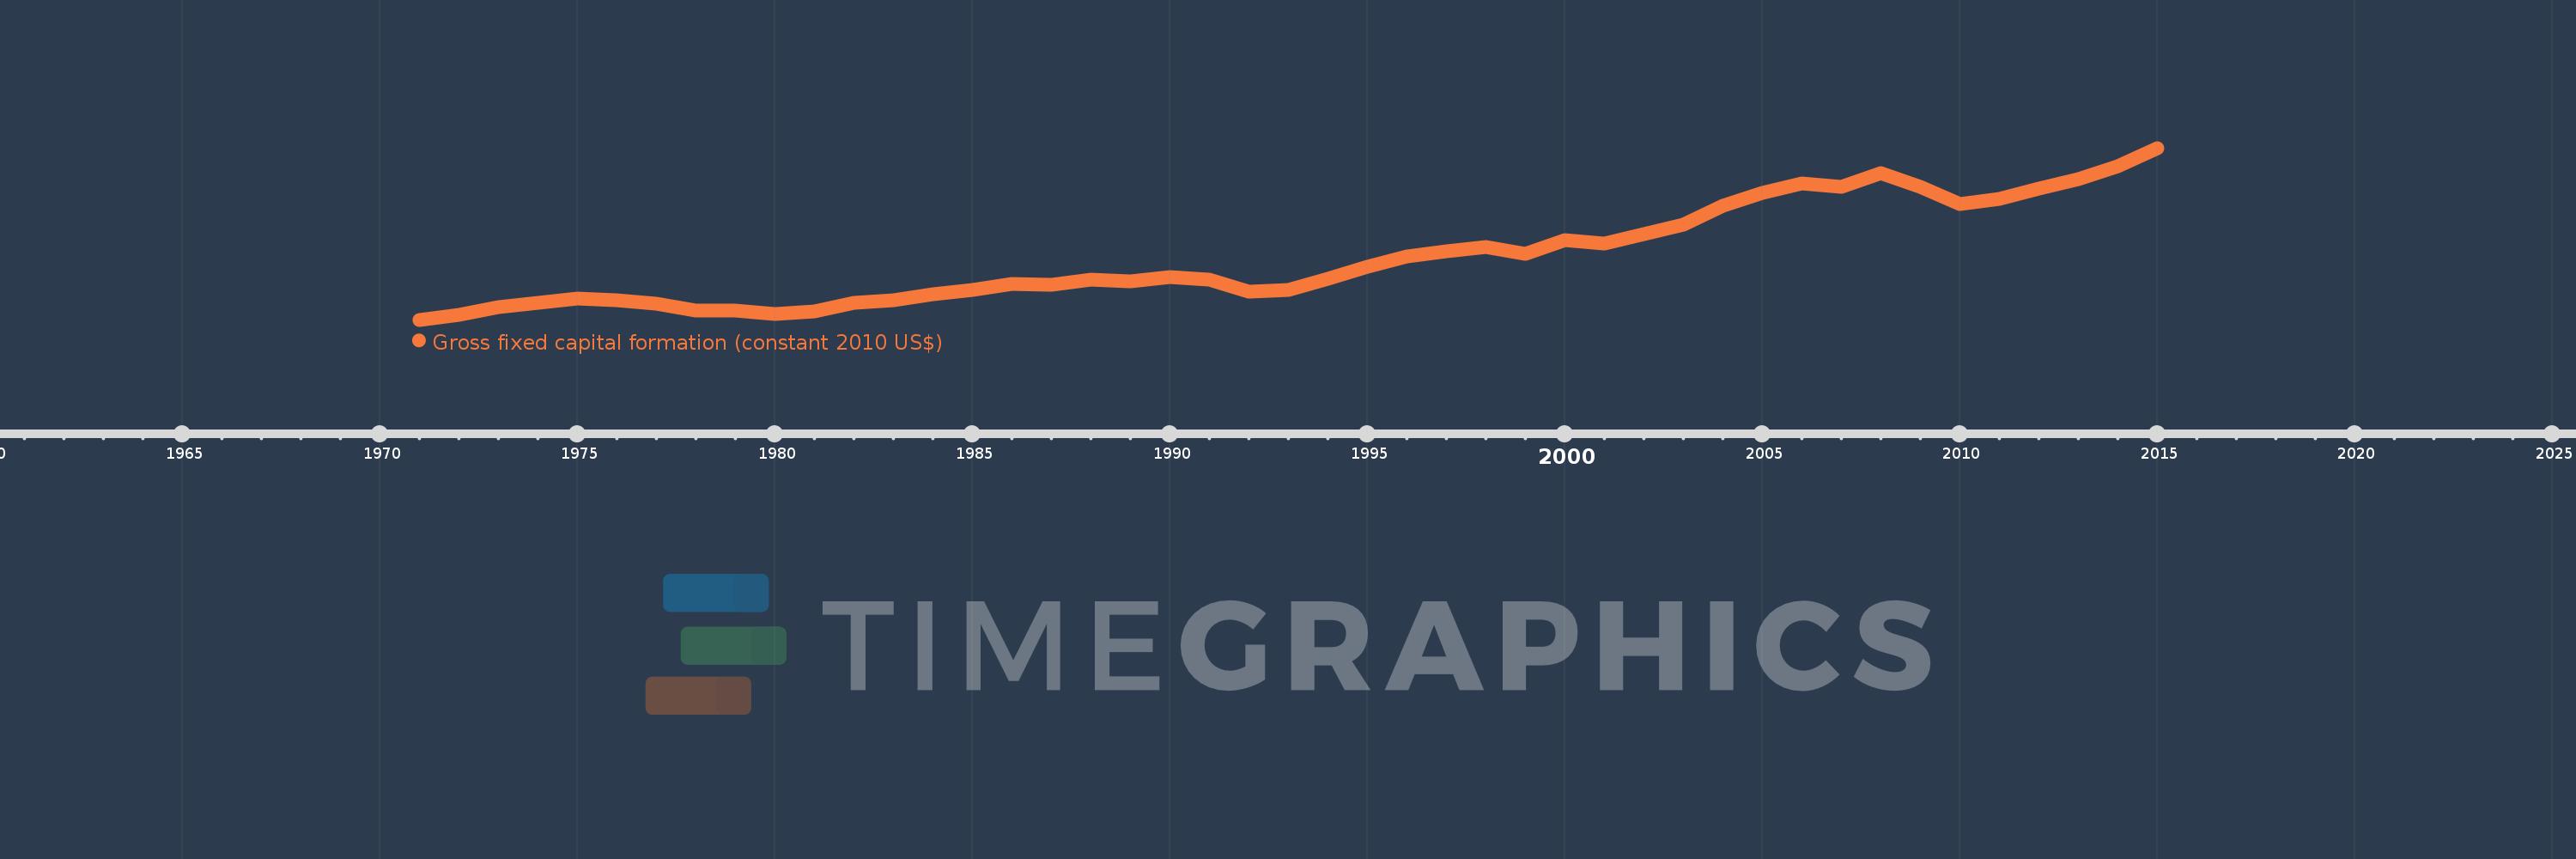
Gross fixed capital formation (constant 2010 US$)
2015,2014,2013,2012,2011,2010,2009,2008,2007,2006,2005,2004,2003,2002,2001,2000,1999,1998,1997,1996,1995,1994,1993,1992,1991,1990,1989,1988,1987,1986,1985,1984,1983,1982,1981,1980,1979,1978,1977,1976,1975,1974,1973,1972,1971
This statistics in other country:
AfghanistanAlbaniaAlgeriaAngolaAntigua and BarbudaArab WorldArgentinaArmeniaAustraliaAustriaAzerbaijanBahamas, TheBahrainBangladeshBarbadosBelarusBelgiumBelizeBeninBermudaBhutanBoliviaBosnia and HerzegovinaBotswanaBrazilBrunei DarussalamBulgariaBurkina FasoBurundiCabo VerdeCambodiaCameroonCanadaCaribbean small statesCentral African RepublicCentral Europe and the BalticsChadChileChinaColombiaComorosCongo, Dem. Rep.Congo, Rep.Costa RicaCote d'IvoireCroatiaCubaCyprusCzech RepublicDenmarkDominicaDominican RepublicEarly-demographic dividendEast Asia & PacificEast Asia & Pacific (excluding high income)East Asia & Pacific (IDA & IBRD countries)EcuadorEgypt, Arab Rep.El SalvadorEquatorial GuineaEritreaEstoniaEuro areaEurope & Central AsiaEurope & Central Asia (excluding high income)Europe & Central Asia (IDA & IBRD countries)European UnionFinlandFragile and conflict affected situationsFranceGabonGambia, TheGeorgiaGermanyGhanaGreeceGrenadaGuatemalaGuineaGuinea-BissauGuyanaHaitiHeavily indebted poor countries (HIPC)High incomeHondurasHong Kong SAR, ChinaHungaryIBRD onlyIcelandIDA & IBRD totalIDA blendIDA onlyIDA totalIndiaIndonesiaIran, Islamic Rep.IraqIrelandIsraelItalyJamaicaJapanJordanKazakhstanKenyaKorea, Rep.KosovoKyrgyz RepublicLao PDRLate-demographic dividendLatin America & Caribbean Latin America & Caribbean (excluding high income)Latin America & the Caribbean (IDA & IBRD countries)LatviaLeast developed countries: UN classificationLebanonLiberiaLithuaniaLow & middle incomeLow incomeLower middle incomeLuxembourgMacao SAR, ChinaMacedonia, FYRMadagascarMalawiMalaysiaMaliMaltaMauritaniaMauritiusMexicoMiddle East & North AfricaMiddle East & North Africa (excluding high income)Middle East & North Africa (IDA & IBRD countries)Middle incomeMoldovaMongoliaMontenegroMoroccoMozambiqueNamibiaNepalNetherlandsNew ZealandNicaraguaNigerNigeriaNorth AmericaNorwayOECD membersOmanPakistanPanamaParaguayPeruPhilippinesPolandPortugalPost-demographic dividendPre-demographic dividendPuerto RicoRomaniaRussian FederationRwandaSaudi ArabiaSenegalSerbiaSeychellesSierra LeoneSingaporeSlovak RepublicSloveniaSouth AfricaSouth AsiaSouth Asia (IDA & IBRD)South SudanSpainSri LankaSt. Kitts and NevisSt. LuciaSt. Vincent and the GrenadinesSub-Saharan Africa Sub-Saharan Africa (excluding high income)Sub-Saharan Africa (IDA & IBRD countries)SudanSurinameSwazilandSwedenSwitzerlandTajikistanTanzaniaThailandTimor-LesteTogoTongaTrinidad and TobagoTunisiaTurkeyTurkmenistanUgandaUkraineUnited Arab EmiratesUnited KingdomUnited StatesUpper middle incomeUruguayUzbekistanVanuatuVenezuela, RBVietnamWest Bank and GazaWorldYemen, Rep.ZambiaZimbabwe Timeline:
This timeline shows a graph from 1971 to 2015 of New Zealand. No data until 1970. Number of actual observations by date: 45.
Source name:
World Development Indicators
Source organization:
World Bank national accounts data, and OECD National Accounts data files.
Categories, topics:
Economy & Growth
Last updated:
apr 23, 2017
Indicators value changes by year
Minimum:
6.873 bln
jan 1, 1971
Maximum:
37.958 bln
jan 1, 2015
At the date of observation
Value
Absolute change
Change from previous value
jan 1, 1971
6.873 bln
+6.873 bln
0.0%
jan 1, 1972
7.82 bln
+946.803 mln
13.78%
jan 1, 1973
9.102 bln
+1.282 bln
16.4%
jan 1, 1974
9.92 bln
+817.478 mln
8.98%
jan 1, 1975
10.773 bln
+853.507 mln
8.6%
jan 1, 1976
10.358 bln
-415.029 mln
-3.85%
jan 1, 1977
9.744 bln
-614.026 mln
-5.93%
jan 1, 1978
8.608 bln
-1.137 bln
-11.67%
jan 1, 1979
8.51 bln
-97.928 mln
-1.14%
jan 1, 1980
7.875 bln
-634.99 mln
-7.46%
jan 1, 1981
8.325 bln
+450.441 mln
5.72%
jan 1, 1982
9.864 bln
+1.539 bln
18.49%
jan 1, 1983
10.409 bln
+544.668 mln
5.52%
jan 1, 1984
11.456 bln
+1.047 bln
10.06%
jan 1, 1985
12.312 bln
+856.123 mln
7.47%
jan 1, 1986
13.38 bln
+1.067 bln
8.67%
jan 1, 1987
13.179 bln
-201.046 mln
-1.5%
jan 1, 1988
14.159 bln
+980.169 mln
7.44%
jan 1, 1989
13.877 bln
-281.31 mln
-1.99%
jan 1, 1990
14.59 bln
+712.177 mln
5.13%
jan 1, 1991
14.131 bln
-458.642 mln
-3.14%
jan 1, 1992
11.947 bln
-2.184 bln
-15.46%
jan 1, 1993
12.258 bln
+311.222 mln
2.61%
jan 1, 1994
14.336 bln
+2.078 bln
16.95%
jan 1, 1995
16.517 bln
+2.181 bln
15.21%
jan 1, 1996
18.336 bln
+1.82 bln
11.02%
jan 1, 1997
19.195 bln
+858.174 mln
4.68%
jan 1, 1998
20.023 bln
+828.262 mln
4.32%
jan 1, 1999
18.769 bln
-1.253 bln
-6.26%
jan 1, 2000
21.271 bln
+2.502 bln
13.33%
jan 1, 2001
20.629 bln
-642.384 mln
-3.02%
jan 1, 2002
22.374 bln
+1.745 bln
8.46%
jan 1, 2003
24.143 bln
+1.769 bln
7.91%
jan 1, 2004
27.567 bln
+3.424 bln
14.18%
jan 1, 2005
29.804 bln
+2.237 bln
8.11%
jan 1, 2006
31.499 bln
+1.695 bln
5.69%
jan 1, 2007
30.968 bln
-530.572 mln
-1.68%
jan 1, 2008
33.378 bln
+2.409 bln
7.78%
jan 1, 2009
30.977 bln
-2.401 bln
-7.19%
jan 1, 2010
27.801 bln
-3.176 bln
-10.25%
jan 1, 2011
28.817 bln
+1.016 bln
3.65%
jan 1, 2012
30.538 bln
+1.721 bln
5.97%
jan 1, 2013
32.287 bln
+1.749 bln
5.73%
jan 1, 2014
34.61 bln
+2.323 bln
7.2%
jan 1, 2015
37.958 bln
+3.347 bln
9.67%
Ranking of countries by current statistics by years


Comments: