29
/
en
AIzaSyAYiBZKx7MnpbEhh9jyipgxe19OcubqV5w
April 1, 2024
213018
Nigeria
NGA
true
2
1
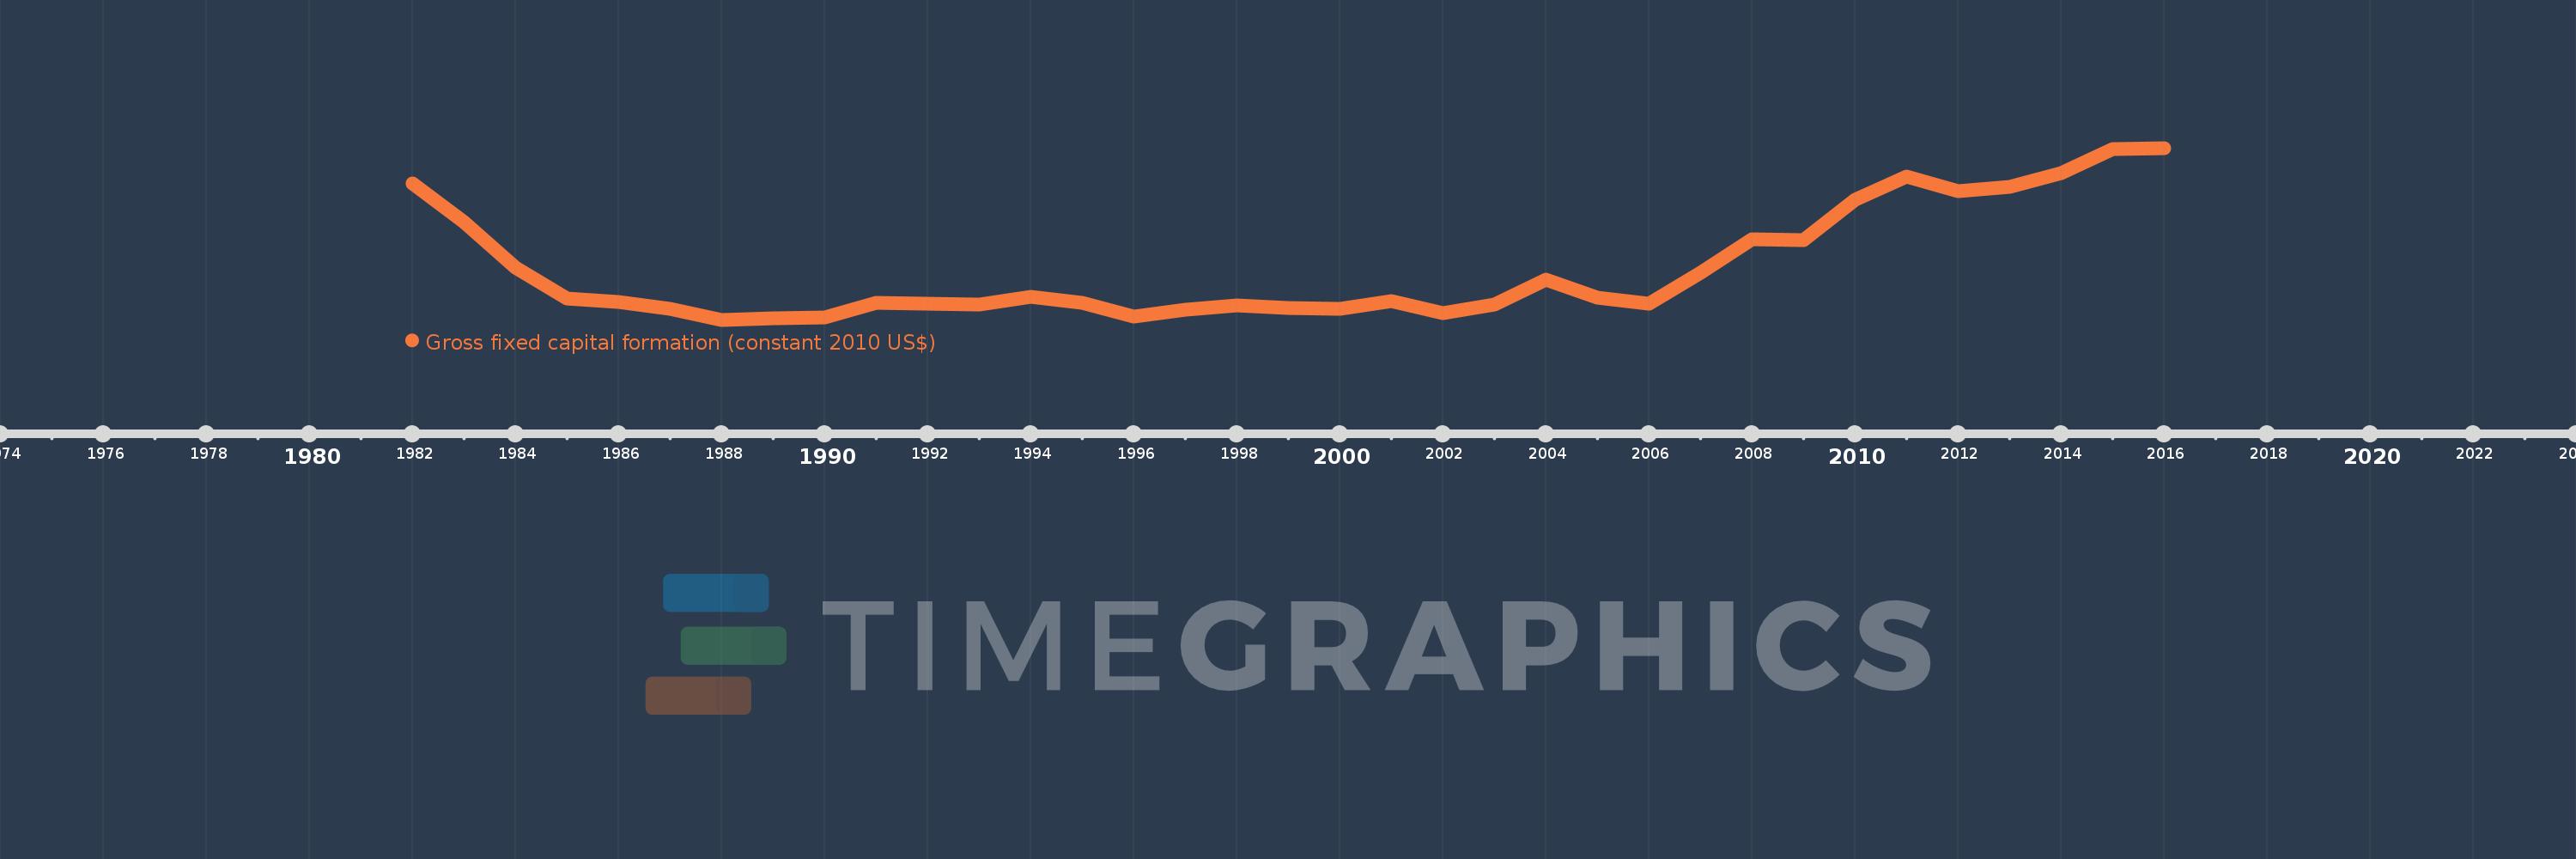
Gross fixed capital formation (constant 2010 US$)
2016,2015,2014,2013,2012,2011,2010,2009,2008,2007,2006,2005,2004,2003,2002,2001,2000,1999,1998,1997,1996,1995,1994,1993,1992,1991,1990,1989,1988,1987,1986,1985,1984,1983,1982
This statistics in other country:
AfghanistanAlbaniaAlgeriaAngolaAntigua and BarbudaArab WorldArgentinaArmeniaAustraliaAustriaAzerbaijanBahamas, TheBahrainBangladeshBarbadosBelarusBelgiumBelizeBeninBermudaBhutanBoliviaBosnia and HerzegovinaBotswanaBrazilBrunei DarussalamBulgariaBurkina FasoBurundiCabo VerdeCambodiaCameroonCanadaCaribbean small statesCentral African RepublicCentral Europe and the BalticsChadChileChinaColombiaComorosCongo, Dem. Rep.Congo, Rep.Costa RicaCote d'IvoireCroatiaCubaCyprusCzech RepublicDenmarkDominicaDominican RepublicEarly-demographic dividendEast Asia & PacificEast Asia & Pacific (excluding high income)East Asia & Pacific (IDA & IBRD countries)EcuadorEgypt, Arab Rep.El SalvadorEquatorial GuineaEritreaEstoniaEuro areaEurope & Central AsiaEurope & Central Asia (excluding high income)Europe & Central Asia (IDA & IBRD countries)European UnionFinlandFragile and conflict affected situationsFranceGabonGambia, TheGeorgiaGermanyGhanaGreeceGrenadaGuatemalaGuineaGuinea-BissauGuyanaHaitiHeavily indebted poor countries (HIPC)High incomeHondurasHong Kong SAR, ChinaHungaryIBRD onlyIcelandIDA & IBRD totalIDA blendIDA onlyIDA totalIndiaIndonesiaIran, Islamic Rep.IraqIrelandIsraelItalyJamaicaJapanJordanKazakhstanKenyaKorea, Rep.KosovoKyrgyz RepublicLao PDRLate-demographic dividendLatin America & Caribbean Latin America & Caribbean (excluding high income)Latin America & the Caribbean (IDA & IBRD countries)LatviaLeast developed countries: UN classificationLebanonLiberiaLithuaniaLow & middle incomeLow incomeLower middle incomeLuxembourgMacao SAR, ChinaMacedonia, FYRMadagascarMalawiMalaysiaMaliMaltaMauritaniaMauritiusMexicoMiddle East & North AfricaMiddle East & North Africa (excluding high income)Middle East & North Africa (IDA & IBRD countries)Middle incomeMoldovaMongoliaMontenegroMoroccoMozambiqueNamibiaNepalNetherlandsNew ZealandNicaraguaNigerNigeriaNorth AmericaNorwayOECD membersOmanPakistanPanamaParaguayPeruPhilippinesPolandPortugalPost-demographic dividendPre-demographic dividendPuerto RicoRomaniaRussian FederationRwandaSaudi ArabiaSenegalSerbiaSeychellesSierra LeoneSingaporeSlovak RepublicSloveniaSouth AfricaSouth AsiaSouth Asia (IDA & IBRD)South SudanSpainSri LankaSt. Kitts and NevisSt. LuciaSt. Vincent and the GrenadinesSub-Saharan Africa Sub-Saharan Africa (excluding high income)Sub-Saharan Africa (IDA & IBRD countries)SudanSurinameSwazilandSwedenSwitzerlandTajikistanTanzaniaThailandTimor-LesteTogoTongaTrinidad and TobagoTunisiaTurkeyTurkmenistanUgandaUkraineUnited Arab EmiratesUnited KingdomUnited StatesUpper middle incomeUruguayUzbekistanVanuatuVenezuela, RBVietnamWest Bank and GazaWorldYemen, Rep.ZambiaZimbabwe Timeline:
This timeline shows a graph from 1982 to 2016 of Nigeria. No data until 1981. Number of actual observations by date: 35.
Source name:
World Development Indicators
Source organization:
World Bank national accounts data, and OECD National Accounts data files.
Categories, topics:
Economy & Growth
Last updated:
apr 23, 2017
Indicators value changes by year
Minimum:
11.967 bln
jan 1, 1988
Maximum:
70.768 bln
jan 1, 2016
At the date of observation
Value
Absolute change
Change from previous value
jan 1, 1982
58.698 bln
+58.698 bln
0.0%
jan 1, 1983
45.521 bln
-13.176 bln
-22.45%
jan 1, 1984
29.852 bln
-15.669 bln
-34.42%
jan 1, 1985
19.106 bln
-10.746 bln
-36.0%
jan 1, 1986
18.036 bln
-1.07 bln
-5.6%
jan 1, 1987
15.658 bln
-2.379 bln
-13.19%
jan 1, 1988
11.967 bln
-3.691 bln
-23.57%
jan 1, 1989
12.5 bln
+533.417 mln
4.46%
jan 1, 1990
12.75 bln
+249.965 mln
2.0%
jan 1, 1991
17.678 bln
+4.928 bln
38.65%
jan 1, 1992
17.611 bln
-67.321 mln
-0.38%
jan 1, 1993
17.083 bln
-527.394 mln
-2.99%
jan 1, 1994
19.816 bln
+2.732 bln
15.99%
jan 1, 1995
17.803 bln
-2.013 bln
-10.16%
jan 1, 1996
13.139 bln
-4.663 bln
-26.2%
jan 1, 1997
15.517 bln
+2.378 bln
18.1%
jan 1, 1998
16.888 bln
+1.372 bln
8.84%
jan 1, 1999
16.034 bln
-854.136 mln
-5.06%
jan 1, 2000
15.565 bln
-469.136 mln
-2.93%
jan 1, 2001
18.216 bln
+2.651 bln
17.03%
jan 1, 2002
14.262 bln
-3.954 bln
-21.71%
jan 1, 2003
17.163 bln
+2.901 bln
20.34%
jan 1, 2004
25.768 bln
+8.605 bln
50.14%
jan 1, 2005
19.583 bln
-6.186 bln
-24.0%
jan 1, 2006
17.534 bln
-2.048 bln
-10.46%
jan 1, 2007
27.948 bln
+10.413 bln
59.39%
jan 1, 2008
39.61 bln
+11.662 bln
41.73%
jan 1, 2009
39.322 bln
-287.439 mln
-0.73%
jan 1, 2010
52.994 bln
+13.672 bln
34.77%
jan 1, 2011
61.099 bln
+8.105 bln
15.29%
jan 1, 2012
56.06 bln
-5.039 bln
-8.25%
jan 1, 2013
57.491 bln
+1.431 bln
2.55%
jan 1, 2014
62.012 bln
+4.522 bln
7.86%
jan 1, 2015
70.339 bln
+8.326 bln
13.43%
jan 1, 2016
70.768 bln
+428.999 mln
0.61%
Ranking of countries by current statistics by years


Comments: