29
/
en
AIzaSyAYiBZKx7MnpbEhh9jyipgxe19OcubqV5w
April 1, 2024
235832
Senegal
SEN
true
2
1
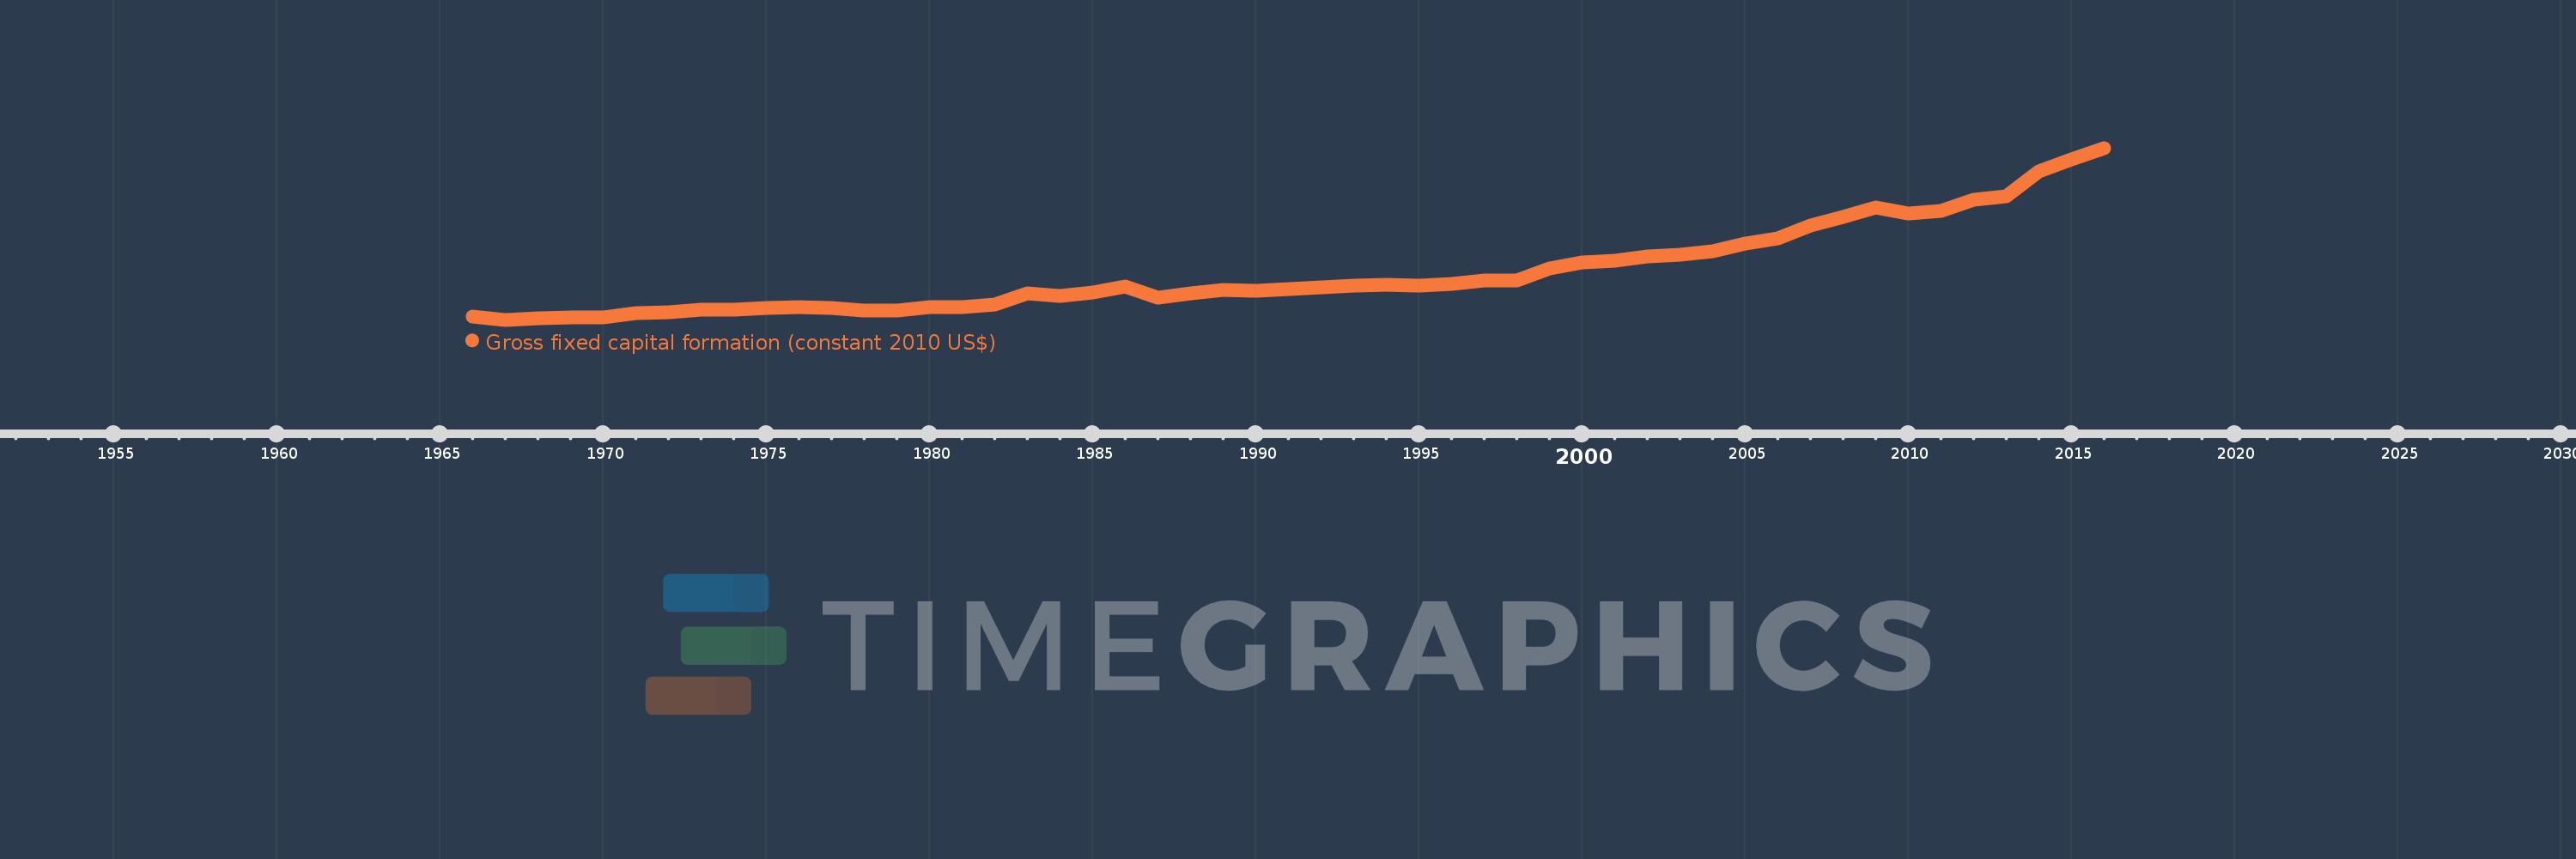
Gross fixed capital formation (constant 2010 US$)
2016,2015,2014,2013,2012,2011,2010,2009,2008,2007,2006,2005,2004,2003,2002,2001,2000,1999,1998,1997,1996,1995,1994,1993,1992,1991,1990,1989,1988,1987,1986,1985,1984,1983,1982,1981,1980,1979,1978,1977,1976,1975,1974,1973,1972,1971,1970,1969,1968,1967,1966
This statistics in other country:
AfghanistanAlbaniaAlgeriaAngolaAntigua and BarbudaArab WorldArgentinaArmeniaAustraliaAustriaAzerbaijanBahamas, TheBahrainBangladeshBarbadosBelarusBelgiumBelizeBeninBermudaBhutanBoliviaBosnia and HerzegovinaBotswanaBrazilBrunei DarussalamBulgariaBurkina FasoBurundiCabo VerdeCambodiaCameroonCanadaCaribbean small statesCentral African RepublicCentral Europe and the BalticsChadChileChinaColombiaComorosCongo, Dem. Rep.Congo, Rep.Costa RicaCote d'IvoireCroatiaCubaCyprusCzech RepublicDenmarkDominicaDominican RepublicEarly-demographic dividendEast Asia & PacificEast Asia & Pacific (excluding high income)East Asia & Pacific (IDA & IBRD countries)EcuadorEgypt, Arab Rep.El SalvadorEquatorial GuineaEritreaEstoniaEuro areaEurope & Central AsiaEurope & Central Asia (excluding high income)Europe & Central Asia (IDA & IBRD countries)European UnionFinlandFragile and conflict affected situationsFranceGabonGambia, TheGeorgiaGermanyGhanaGreeceGrenadaGuatemalaGuineaGuinea-BissauGuyanaHaitiHeavily indebted poor countries (HIPC)High incomeHondurasHong Kong SAR, ChinaHungaryIBRD onlyIcelandIDA & IBRD totalIDA blendIDA onlyIDA totalIndiaIndonesiaIran, Islamic Rep.IraqIrelandIsraelItalyJamaicaJapanJordanKazakhstanKenyaKorea, Rep.KosovoKyrgyz RepublicLao PDRLate-demographic dividendLatin America & Caribbean Latin America & Caribbean (excluding high income)Latin America & the Caribbean (IDA & IBRD countries)LatviaLeast developed countries: UN classificationLebanonLiberiaLithuaniaLow & middle incomeLow incomeLower middle incomeLuxembourgMacao SAR, ChinaMacedonia, FYRMadagascarMalawiMalaysiaMaliMaltaMauritaniaMauritiusMexicoMiddle East & North AfricaMiddle East & North Africa (excluding high income)Middle East & North Africa (IDA & IBRD countries)Middle incomeMoldovaMongoliaMontenegroMoroccoMozambiqueNamibiaNepalNetherlandsNew ZealandNicaraguaNigerNigeriaNorth AmericaNorwayOECD membersOmanPakistanPanamaParaguayPeruPhilippinesPolandPortugalPost-demographic dividendPre-demographic dividendPuerto RicoRomaniaRussian FederationRwandaSaudi ArabiaSenegalSerbiaSeychellesSierra LeoneSingaporeSlovak RepublicSloveniaSouth AfricaSouth AsiaSouth Asia (IDA & IBRD)South SudanSpainSri LankaSt. Kitts and NevisSt. LuciaSt. Vincent and the GrenadinesSub-Saharan Africa Sub-Saharan Africa (excluding high income)Sub-Saharan Africa (IDA & IBRD countries)SudanSurinameSwazilandSwedenSwitzerlandTajikistanTanzaniaThailandTimor-LesteTogoTongaTrinidad and TobagoTunisiaTurkeyTurkmenistanUgandaUkraineUnited Arab EmiratesUnited KingdomUnited StatesUpper middle incomeUruguayUzbekistanVanuatuVenezuela, RBVietnamWest Bank and GazaWorldYemen, Rep.ZambiaZimbabwe Timeline:
This timeline shows a graph from 1966 to 2016 of Senegal. No data until 1965. Number of actual observations by date: 51.
Source name:
World Development Indicators
Source organization:
World Bank national accounts data, and OECD National Accounts data files.
Categories, topics:
Economy & Growth
Last updated:
apr 23, 2017
Indicators value changes by year
Minimum:
362.612 mln
jan 1, 1967
Maximum:
4.333 bln
jan 1, 2016
At the date of observation
Value
Absolute change
Change from previous value
jan 1, 1966
442.331 mln
+442.331 mln
0.0%
jan 1, 1967
362.612 mln
-79.72 mln
-18.02%
jan 1, 1968
390.881 mln
+28.27 mln
7.8%
jan 1, 1969
407.464 mln
+16.583 mln
4.24%
jan 1, 1970
416.136 mln
+8.672 mln
2.13%
jan 1, 1971
515.08 mln
+98.944 mln
23.78%
jan 1, 1972
530.723 mln
+15.642 mln
3.04%
jan 1, 1973
604.412 mln
+73.69 mln
13.88%
jan 1, 1974
590.278 mln
-14.135 mln
-2.34%
jan 1, 1975
639.847 mln
+49.569 mln
8.4%
jan 1, 1976
662.46 mln
+22.613 mln
3.53%
jan 1, 1977
629.667 mln
-32.792 mln
-4.95%
jan 1, 1978
570.07 mln
-59.597 mln
-9.46%
jan 1, 1979
576.143 mln
+6.072 mln
1.07%
jan 1, 1980
651.993 mln
+75.85 mln
13.17%
jan 1, 1981
652.482 mln
+489.376K
0.08%
jan 1, 1982
718.592 mln
+66.11 mln
10.13%
jan 1, 1983
980.363 mln
+261.771 mln
36.43%
jan 1, 1984
911.873 mln
-68.489 mln
-6.99%
jan 1, 1985
984.783 mln
+72.909 mln
8.0%
jan 1, 1986
1.125 bln
+140.445 mln
14.26%
jan 1, 1987
868.617 mln
-256.611 mln
-22.81%
jan 1, 1988
963.856 mln
+95.239 mln
10.96%
jan 1, 1989
1.044 bln
+80.362 mln
8.34%
jan 1, 1990
1.038 bln
-6.374 mln
-0.61%
jan 1, 1991
1.07 bln
+32.18 mln
3.1%
jan 1, 1992
1.106 bln
+36.43 mln
3.4%
jan 1, 1993
1.157 bln
+50.744 mln
4.59%
jan 1, 1994
1.168 bln
+10.396 mln
0.9%
jan 1, 1995
1.151 bln
-16.666 mln
-1.43%
jan 1, 1996
1.187 bln
+36.565 mln
3.18%
jan 1, 1997
1.278 bln
+90.267 mln
7.6%
jan 1, 1998
1.265 bln
-13.177 mln
-1.03%
jan 1, 1999
1.55 bln
+285.236 mln
22.56%
jan 1, 2000
1.694 bln
+144.65 mln
9.33%
jan 1, 2001
1.718 bln
+23.666 mln
1.4%
jan 1, 2002
1.819 bln
+101.017 mln
5.88%
jan 1, 2003
1.868 bln
+49.248 mln
2.71%
jan 1, 2004
1.936 bln
+67.706 mln
3.62%
jan 1, 2005
2.119 bln
+183.323 mln
9.47%
jan 1, 2006
2.248 bln
+128.476 mln
6.06%
jan 1, 2007
2.544 bln
+296.296 mln
13.18%
jan 1, 2008
2.733 bln
+189.191 mln
7.44%
jan 1, 2009
2.954 bln
+221.078 mln
8.09%
jan 1, 2010
2.828 bln
-126.537 mln
-4.28%
jan 1, 2011
2.87 bln
+42.128 mln
1.49%
jan 1, 2012
3.129 bln
+259.095 mln
9.03%
jan 1, 2013
3.22 bln
+90.423 mln
2.89%
jan 1, 2014
3.792 bln
+571.988 mln
17.77%
jan 1, 2015
4.077 bln
+285.738 mln
7.54%
jan 1, 2016
4.333 bln
+255.898 mln
6.28%
Ranking of countries by current statistics by years


Comments: