29
/
en
AIzaSyAYiBZKx7MnpbEhh9jyipgxe19OcubqV5w
April 1, 2024
229812
Russian Federation
RUS
true
2
1
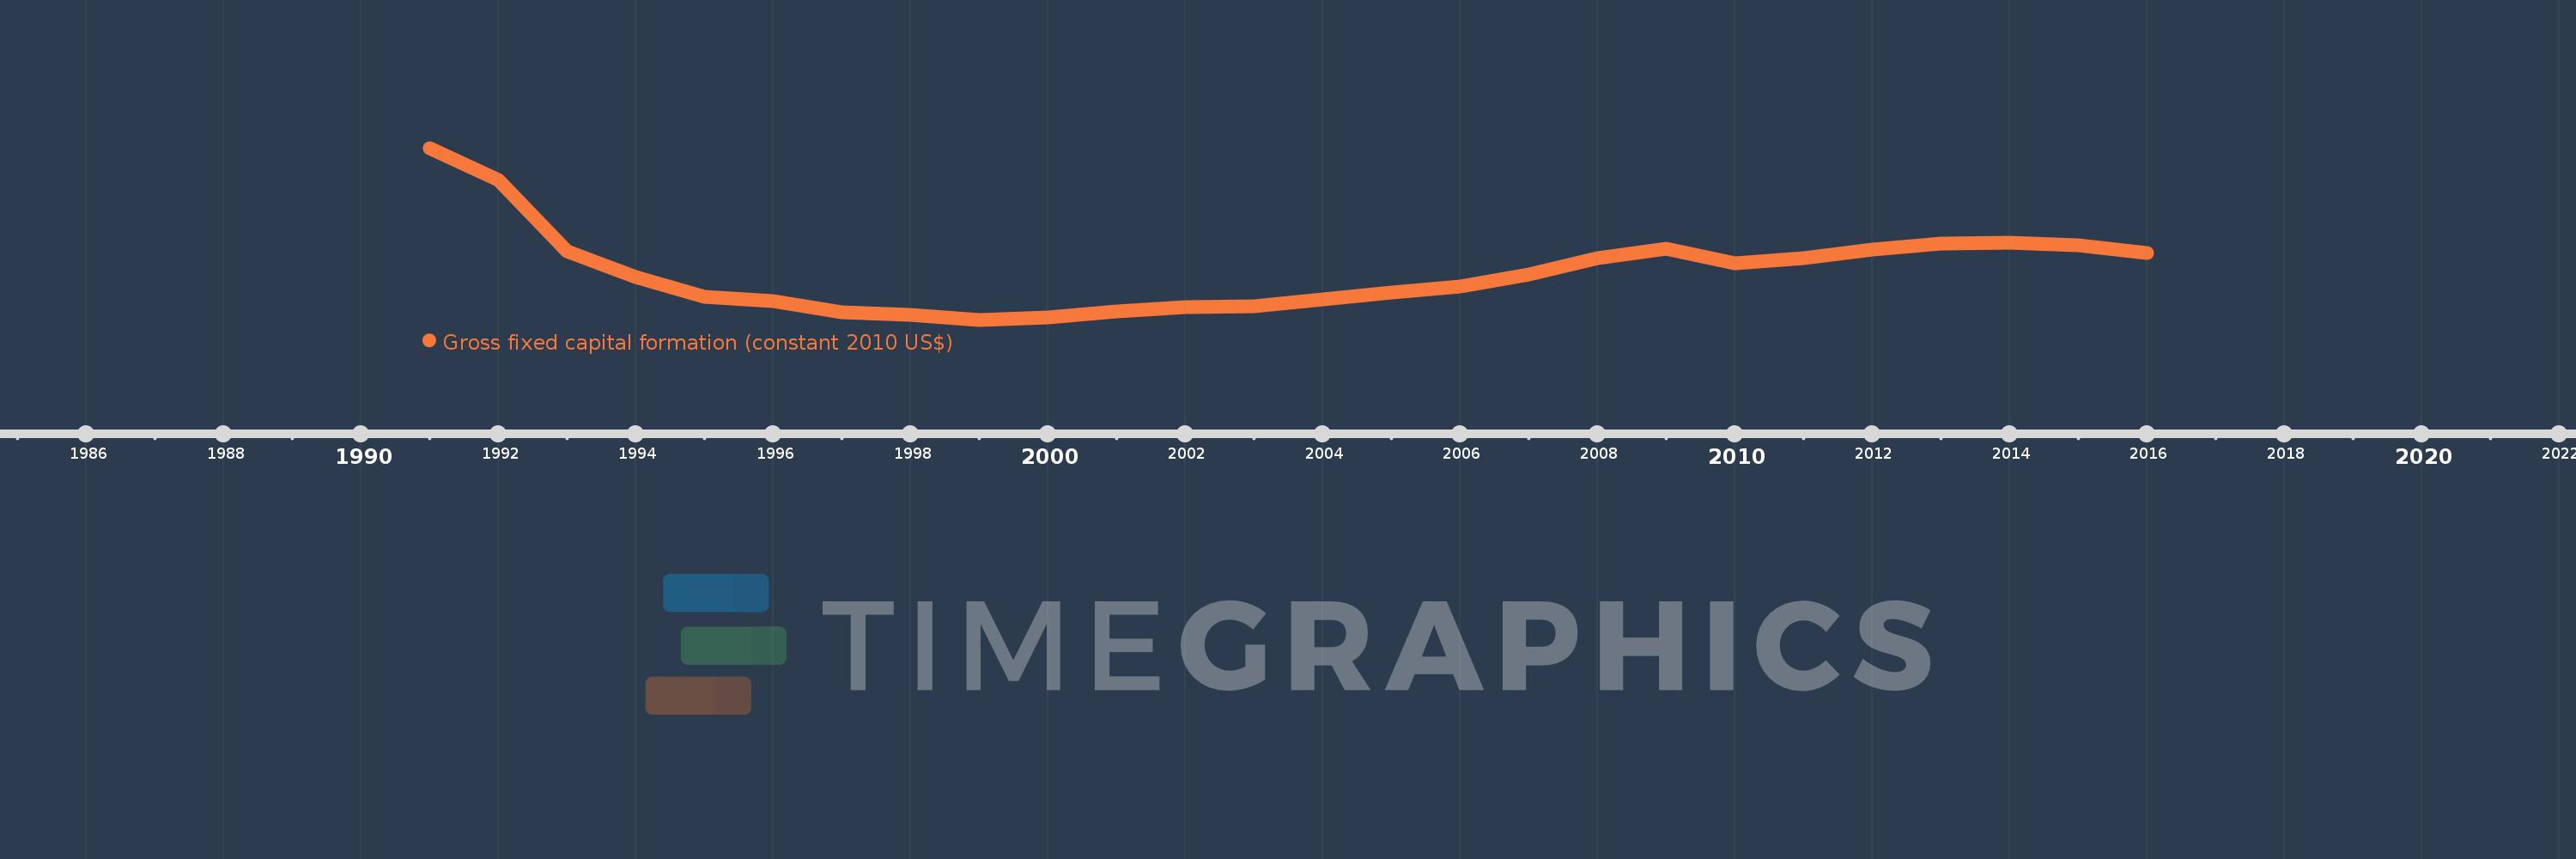
Gross fixed capital formation (constant 2010 US$)
2016,2015,2014,2013,2012,2011,2010,2009,2008,2007,2006,2005,2004,2003,2002,2001,2000,1999,1998,1997,1996,1995,1994,1993,1992,1991
This statistics in other country:
AfghanistanAlbaniaAlgeriaAngolaAntigua and BarbudaArab WorldArgentinaArmeniaAustraliaAustriaAzerbaijanBahamas, TheBahrainBangladeshBarbadosBelarusBelgiumBelizeBeninBermudaBhutanBoliviaBosnia and HerzegovinaBotswanaBrazilBrunei DarussalamBulgariaBurkina FasoBurundiCabo VerdeCambodiaCameroonCanadaCaribbean small statesCentral African RepublicCentral Europe and the BalticsChadChileChinaColombiaComorosCongo, Dem. Rep.Congo, Rep.Costa RicaCote d'IvoireCroatiaCubaCyprusCzech RepublicDenmarkDominicaDominican RepublicEarly-demographic dividendEast Asia & PacificEast Asia & Pacific (excluding high income)East Asia & Pacific (IDA & IBRD countries)EcuadorEgypt, Arab Rep.El SalvadorEquatorial GuineaEritreaEstoniaEuro areaEurope & Central AsiaEurope & Central Asia (excluding high income)Europe & Central Asia (IDA & IBRD countries)European UnionFinlandFragile and conflict affected situationsFranceGabonGambia, TheGeorgiaGermanyGhanaGreeceGrenadaGuatemalaGuineaGuinea-BissauGuyanaHaitiHeavily indebted poor countries (HIPC)High incomeHondurasHong Kong SAR, ChinaHungaryIBRD onlyIcelandIDA & IBRD totalIDA blendIDA onlyIDA totalIndiaIndonesiaIran, Islamic Rep.IraqIrelandIsraelItalyJamaicaJapanJordanKazakhstanKenyaKorea, Rep.KosovoKyrgyz RepublicLao PDRLate-demographic dividendLatin America & Caribbean Latin America & Caribbean (excluding high income)Latin America & the Caribbean (IDA & IBRD countries)LatviaLeast developed countries: UN classificationLebanonLiberiaLithuaniaLow & middle incomeLow incomeLower middle incomeLuxembourgMacao SAR, ChinaMacedonia, FYRMadagascarMalawiMalaysiaMaliMaltaMauritaniaMauritiusMexicoMiddle East & North AfricaMiddle East & North Africa (excluding high income)Middle East & North Africa (IDA & IBRD countries)Middle incomeMoldovaMongoliaMontenegroMoroccoMozambiqueNamibiaNepalNetherlandsNew ZealandNicaraguaNigerNigeriaNorth AmericaNorwayOECD membersOmanPakistanPanamaParaguayPeruPhilippinesPolandPortugalPost-demographic dividendPre-demographic dividendPuerto RicoRomaniaRussian FederationRwandaSaudi ArabiaSenegalSerbiaSeychellesSierra LeoneSingaporeSlovak RepublicSloveniaSouth AfricaSouth AsiaSouth Asia (IDA & IBRD)South SudanSpainSri LankaSt. Kitts and NevisSt. LuciaSt. Vincent and the GrenadinesSub-Saharan Africa Sub-Saharan Africa (excluding high income)Sub-Saharan Africa (IDA & IBRD countries)SudanSurinameSwazilandSwedenSwitzerlandTajikistanTanzaniaThailandTimor-LesteTogoTongaTrinidad and TobagoTunisiaTurkeyTurkmenistanUgandaUkraineUnited Arab EmiratesUnited KingdomUnited StatesUpper middle incomeUruguayUzbekistanVanuatuVenezuela, RBVietnamWest Bank and GazaWorldYemen, Rep.ZambiaZimbabwe Timeline:
This timeline shows a graph from 1991 to 2016 of Russian Federation. No data until 1990. Number of actual observations by date: 26.
Source name:
World Development Indicators
Source organization:
World Bank national accounts data, and OECD National Accounts data files.
Categories, topics:
Economy & Growth
Last updated:
apr 23, 2017
Indicators value changes by year
Minimum:
114.087 bln
jan 1, 1999
Maximum:
714.751 bln
jan 1, 1991
At the date of observation
Value
Absolute change
Change from previous value
jan 1, 1991
714.751 bln
+714.751 bln
0.0%
jan 1, 1992
603.964 bln
-110.786 bln
-15.5%
jan 1, 1993
353.319 bln
-250.645 bln
-41.5%
jan 1, 1994
262.163 bln
-91.156 bln
-25.8%
jan 1, 1995
194.0 bln
-68.162 bln
-26.0%
jan 1, 1996
179.45 bln
-14.55 bln
-7.5%
jan 1, 1997
141.407 bln
-38.043 bln
-21.2%
jan 1, 1998
130.236 bln
-11.171 bln
-7.9%
jan 1, 1999
114.087 bln
-16.149 bln
-12.4%
jan 1, 2000
121.388 bln
+7.302 bln
6.4%
jan 1, 2001
143.359 bln
+21.971 bln
18.1%
jan 1, 2002
158.056 bln
+14.697 bln
10.25%
jan 1, 2003
162.405 bln
+4.349 bln
2.75%
jan 1, 2004
184.98 bln
+22.574 bln
13.9%
jan 1, 2005
208.287 bln
+23.307 bln
12.6%
jan 1, 2006
230.366 bln
+22.078 bln
10.6%
jan 1, 2007
271.832 bln
+41.466 bln
18.0%
jan 1, 2008
328.916 bln
+57.085 bln
21.0%
jan 1, 2009
363.781 bln
+34.865 bln
10.6%
jan 1, 2010
311.397 bln
-52.385 bln
-14.4%
jan 1, 2011
329.769 bln
+18.372 bln
5.9%
jan 1, 2012
359.778 bln
+30.009 bln
9.1%
jan 1, 2013
381.414 bln
+21.636 bln
6.01%
jan 1, 2014
384.875 bln
+3.46 bln
0.91%
jan 1, 2015
374.786 bln
-10.089 bln
-2.62%
jan 1, 2016
346.148 bln
-28.638 bln
-7.64%
Ranking of countries by current statistics by years


Comments: