29
/
en
AIzaSyAYiBZKx7MnpbEhh9jyipgxe19OcubqV5w
April 1, 2024
159470
Ireland
IRL
true
2
1
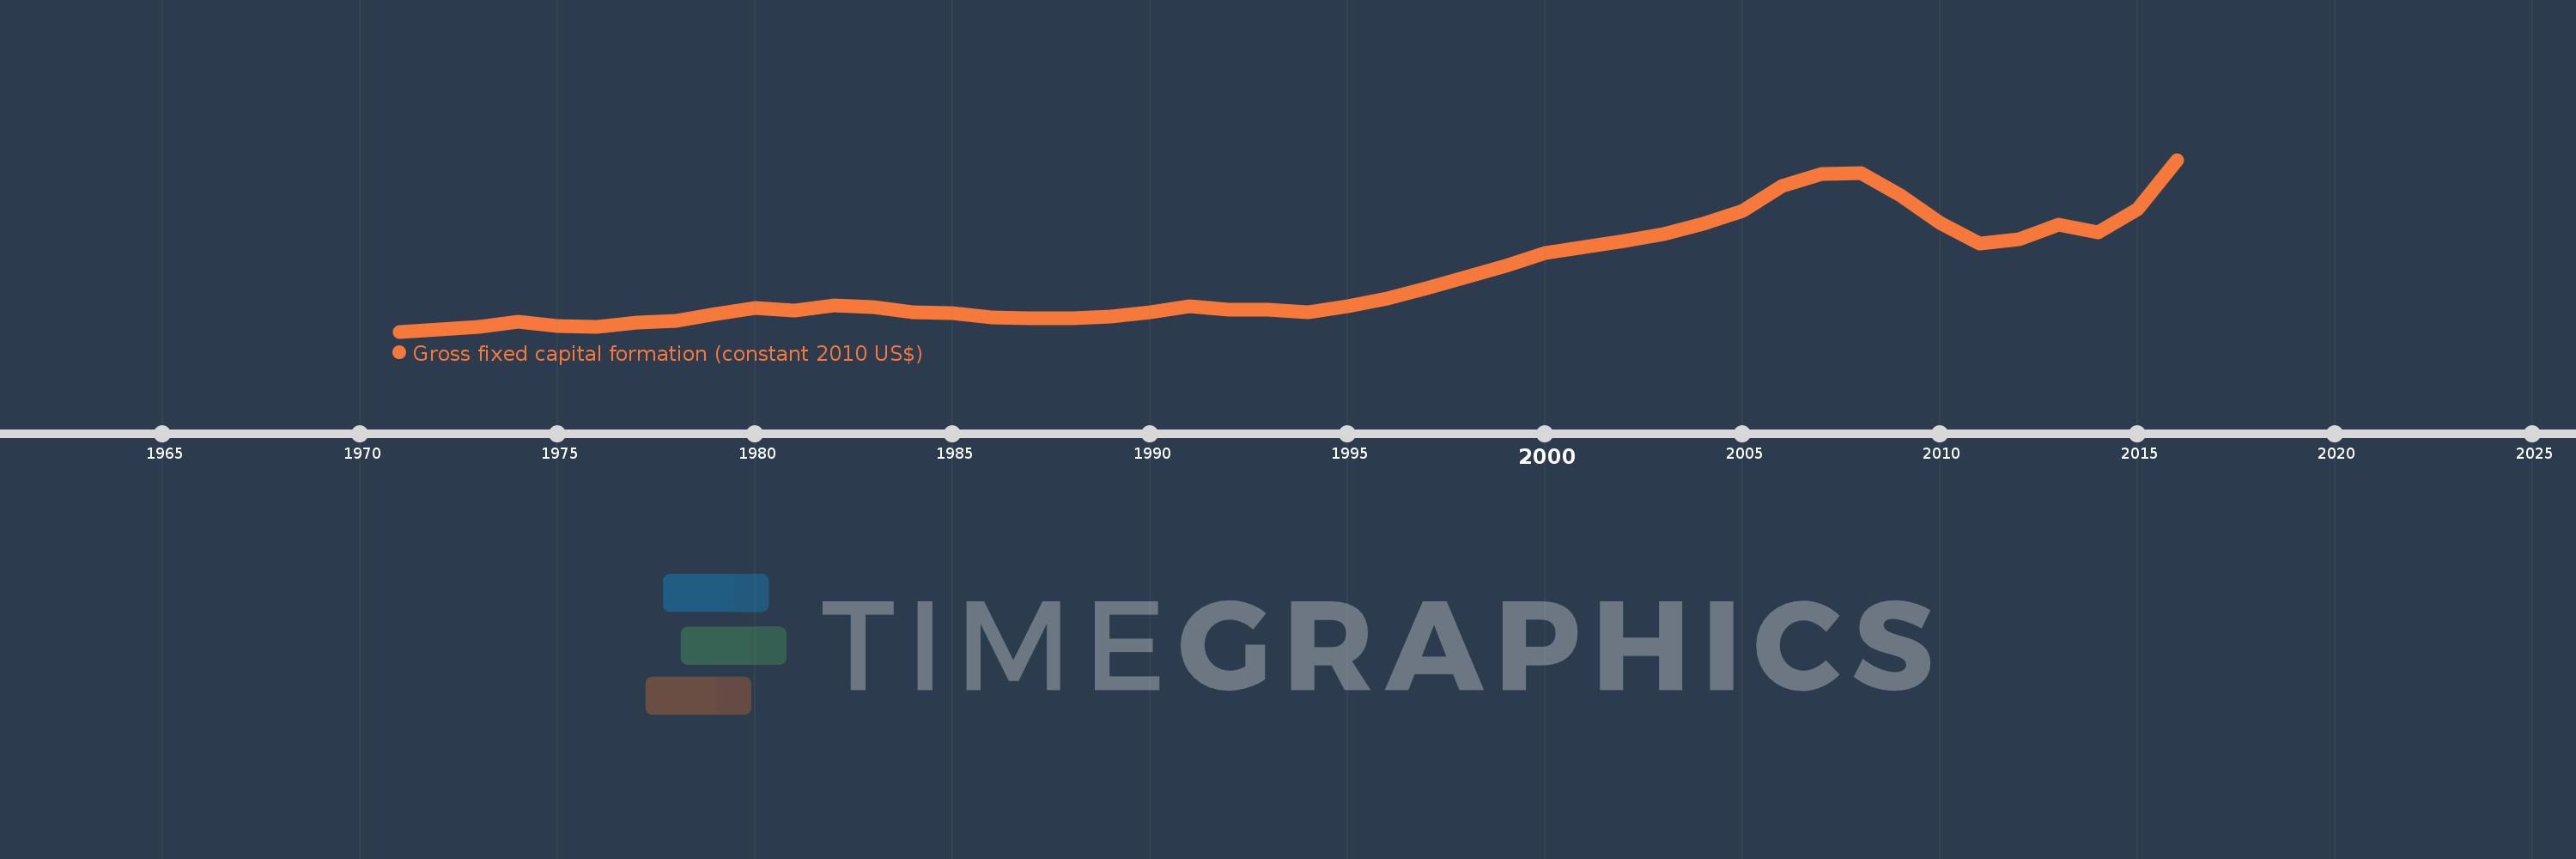
Gross fixed capital formation (constant 2010 US$)
2016,2015,2014,2013,2012,2011,2010,2009,2008,2007,2006,2005,2004,2003,2002,2001,2000,1999,1998,1997,1996,1995,1994,1993,1992,1991,1990,1989,1988,1987,1986,1985,1984,1983,1982,1981,1980,1979,1978,1977,1976,1975,1974,1973,1972,1971
This statistics in other country:
AfghanistanAlbaniaAlgeriaAngolaAntigua and BarbudaArab WorldArgentinaArmeniaAustraliaAustriaAzerbaijanBahamas, TheBahrainBangladeshBarbadosBelarusBelgiumBelizeBeninBermudaBhutanBoliviaBosnia and HerzegovinaBotswanaBrazilBrunei DarussalamBulgariaBurkina FasoBurundiCabo VerdeCambodiaCameroonCanadaCaribbean small statesCentral African RepublicCentral Europe and the BalticsChadChileChinaColombiaComorosCongo, Dem. Rep.Congo, Rep.Costa RicaCote d'IvoireCroatiaCubaCyprusCzech RepublicDenmarkDominicaDominican RepublicEarly-demographic dividendEast Asia & PacificEast Asia & Pacific (excluding high income)East Asia & Pacific (IDA & IBRD countries)EcuadorEgypt, Arab Rep.El SalvadorEquatorial GuineaEritreaEstoniaEuro areaEurope & Central AsiaEurope & Central Asia (excluding high income)Europe & Central Asia (IDA & IBRD countries)European UnionFinlandFragile and conflict affected situationsFranceGabonGambia, TheGeorgiaGermanyGhanaGreeceGrenadaGuatemalaGuineaGuinea-BissauGuyanaHaitiHeavily indebted poor countries (HIPC)High incomeHondurasHong Kong SAR, ChinaHungaryIBRD onlyIcelandIDA & IBRD totalIDA blendIDA onlyIDA totalIndiaIndonesiaIran, Islamic Rep.IraqIrelandIsraelItalyJamaicaJapanJordanKazakhstanKenyaKorea, Rep.KosovoKyrgyz RepublicLao PDRLate-demographic dividendLatin America & Caribbean Latin America & Caribbean (excluding high income)Latin America & the Caribbean (IDA & IBRD countries)LatviaLeast developed countries: UN classificationLebanonLiberiaLithuaniaLow & middle incomeLow incomeLower middle incomeLuxembourgMacao SAR, ChinaMacedonia, FYRMadagascarMalawiMalaysiaMaliMaltaMauritaniaMauritiusMexicoMiddle East & North AfricaMiddle East & North Africa (excluding high income)Middle East & North Africa (IDA & IBRD countries)Middle incomeMoldovaMongoliaMontenegroMoroccoMozambiqueNamibiaNepalNetherlandsNew ZealandNicaraguaNigerNigeriaNorth AmericaNorwayOECD membersOmanPakistanPanamaParaguayPeruPhilippinesPolandPortugalPost-demographic dividendPre-demographic dividendPuerto RicoRomaniaRussian FederationRwandaSaudi ArabiaSenegalSerbiaSeychellesSierra LeoneSingaporeSlovak RepublicSloveniaSouth AfricaSouth AsiaSouth Asia (IDA & IBRD)South SudanSpainSri LankaSt. Kitts and NevisSt. LuciaSt. Vincent and the GrenadinesSub-Saharan Africa Sub-Saharan Africa (excluding high income)Sub-Saharan Africa (IDA & IBRD countries)SudanSurinameSwazilandSwedenSwitzerlandTajikistanTanzaniaThailandTimor-LesteTogoTongaTrinidad and TobagoTunisiaTurkeyTurkmenistanUgandaUkraineUnited Arab EmiratesUnited KingdomUnited StatesUpper middle incomeUruguayUzbekistanVanuatuVenezuela, RBVietnamWest Bank and GazaWorldYemen, Rep.ZambiaZimbabwe Timeline:
This timeline shows a graph from 1971 to 2016 of Ireland. No data until 1970. Number of actual observations by date: 46.
Source name:
World Development Indicators
Source organization:
World Bank national accounts data, and OECD National Accounts data files.
Categories, topics:
Economy & Growth
Last updated:
apr 23, 2017
Indicators value changes by year
Minimum:
9.323 bln
jan 1, 1971
Maximum:
67.043 bln
jan 1, 2016
At the date of observation
Value
Absolute change
Change from previous value
jan 1, 1971
9.323 bln
+9.323 bln
0.0%
jan 1, 1972
10.155 bln
+831.736 mln
8.92%
jan 1, 1973
10.949 bln
+793.93 mln
7.82%
jan 1, 1974
12.719 bln
+1.77 bln
16.16%
jan 1, 1975
11.241 bln
-1.477 bln
-11.62%
jan 1, 1976
10.836 bln
-405.787 mln
-3.61%
jan 1, 1977
12.305 bln
+1.469 bln
13.56%
jan 1, 1978
12.804 bln
+499.042 mln
4.06%
jan 1, 1979
15.221 bln
+2.417 bln
18.88%
jan 1, 1980
17.293 bln
+2.072 bln
13.61%
jan 1, 1981
16.477 bln
-815.774 mln
-4.72%
jan 1, 1982
18.047 bln
+1.57 bln
9.53%
jan 1, 1983
17.431 bln
-615.821 mln
-3.41%
jan 1, 1984
15.813 bln
-1.619 bln
-9.29%
jan 1, 1985
15.415 bln
-397.805 mln
-2.52%
jan 1, 1986
14.226 bln
-1.189 bln
-7.71%
jan 1, 1987
13.828 bln
-397.385 mln
-2.79%
jan 1, 1988
13.671 bln
-157.348 mln
-1.14%
jan 1, 1989
14.387 bln
+715.69 mln
5.24%
jan 1, 1990
15.845 bln
+1.458 bln
10.13%
jan 1, 1991
17.968 bln
+2.124 bln
13.4%
jan 1, 1992
16.713 bln
-1.255 bln
-6.98%
jan 1, 1993
16.709 bln
-4.446 mln
-0.03%
jan 1, 1994
15.859 bln
-849.354 mln
-5.08%
jan 1, 1995
17.737 bln
+1.877 bln
11.84%
jan 1, 1996
20.538 bln
+2.801 bln
15.79%
jan 1, 1997
23.911 bln
+3.374 bln
16.43%
jan 1, 1998
27.691 bln
+3.779 bln
15.81%
jan 1, 1999
31.412 bln
+3.722 bln
13.44%
jan 1, 2000
35.834 bln
+4.421 bln
14.07%
jan 1, 2001
37.644 bln
+1.811 bln
5.05%
jan 1, 2002
39.836 bln
+2.192 bln
5.82%
jan 1, 2003
42.049 bln
+2.213 bln
5.56%
jan 1, 2004
45.402 bln
+3.353 bln
7.98%
jan 1, 2005
49.833 bln
+4.43 bln
9.76%
jan 1, 2006
58.223 bln
+8.391 bln
16.84%
jan 1, 2007
62.422 bln
+4.199 bln
7.21%
jan 1, 2008
62.441 bln
+19.343 mln
0.03%
jan 1, 2009
55.209 bln
-7.232 bln
-11.58%
jan 1, 2010
45.864 bln
-9.346 bln
-16.93%
jan 1, 2011
38.97 bln
-6.893 bln
-15.03%
jan 1, 2012
40.397 bln
+1.427 bln
3.66%
jan 1, 2013
45.192 bln
+4.795 bln
11.87%
jan 1, 2014
42.629 bln
-2.564 bln
-5.67%
jan 1, 2015
50.434 bln
+7.805 bln
18.31%
jan 1, 2016
67.043 bln
+16.61 bln
32.93%
Ranking of countries by current statistics by years


Comments: