29
/
en
AIzaSyAYiBZKx7MnpbEhh9jyipgxe19OcubqV5w
April 1, 2024
127403
Equatorial Guinea
GNQ
true
2
1
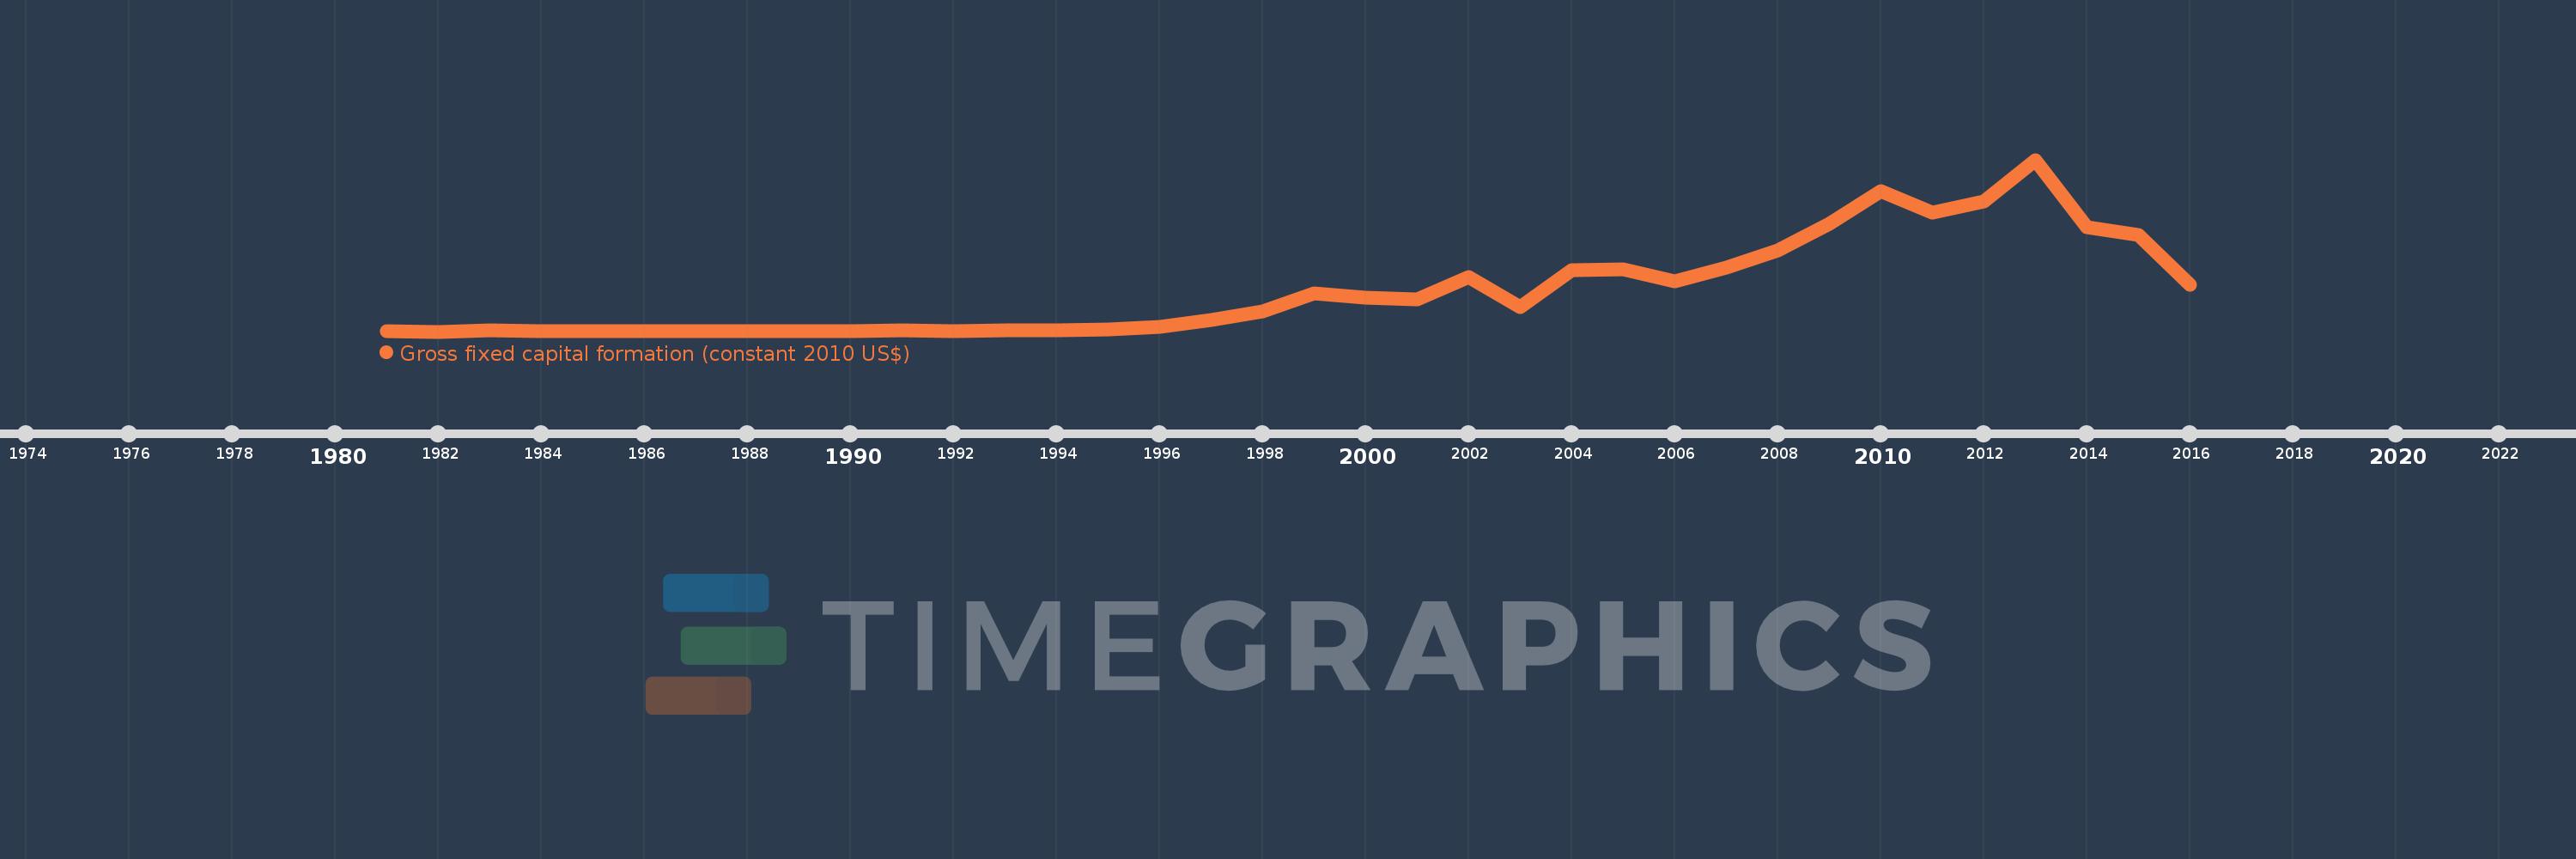
Gross fixed capital formation (constant 2010 US$)
2016,2015,2014,2013,2012,2011,2010,2009,2008,2007,2006,2005,2004,2003,2002,2001,2000,1999,1998,1997,1996,1995,1994,1993,1992,1991,1990,1989,1988,1987,1986,1985,1984,1983,1982,1981
This statistics in other country:
AfghanistanAlbaniaAlgeriaAngolaAntigua and BarbudaArab WorldArgentinaArmeniaAustraliaAustriaAzerbaijanBahamas, TheBahrainBangladeshBarbadosBelarusBelgiumBelizeBeninBermudaBhutanBoliviaBosnia and HerzegovinaBotswanaBrazilBrunei DarussalamBulgariaBurkina FasoBurundiCabo VerdeCambodiaCameroonCanadaCaribbean small statesCentral African RepublicCentral Europe and the BalticsChadChileChinaColombiaComorosCongo, Dem. Rep.Congo, Rep.Costa RicaCote d'IvoireCroatiaCubaCyprusCzech RepublicDenmarkDominicaDominican RepublicEarly-demographic dividendEast Asia & PacificEast Asia & Pacific (excluding high income)East Asia & Pacific (IDA & IBRD countries)EcuadorEgypt, Arab Rep.El SalvadorEquatorial GuineaEritreaEstoniaEuro areaEurope & Central AsiaEurope & Central Asia (excluding high income)Europe & Central Asia (IDA & IBRD countries)European UnionFinlandFragile and conflict affected situationsFranceGabonGambia, TheGeorgiaGermanyGhanaGreeceGrenadaGuatemalaGuineaGuinea-BissauGuyanaHaitiHeavily indebted poor countries (HIPC)High incomeHondurasHong Kong SAR, ChinaHungaryIBRD onlyIcelandIDA & IBRD totalIDA blendIDA onlyIDA totalIndiaIndonesiaIran, Islamic Rep.IraqIrelandIsraelItalyJamaicaJapanJordanKazakhstanKenyaKorea, Rep.KosovoKyrgyz RepublicLao PDRLate-demographic dividendLatin America & Caribbean Latin America & Caribbean (excluding high income)Latin America & the Caribbean (IDA & IBRD countries)LatviaLeast developed countries: UN classificationLebanonLiberiaLithuaniaLow & middle incomeLow incomeLower middle incomeLuxembourgMacao SAR, ChinaMacedonia, FYRMadagascarMalawiMalaysiaMaliMaltaMauritaniaMauritiusMexicoMiddle East & North AfricaMiddle East & North Africa (excluding high income)Middle East & North Africa (IDA & IBRD countries)Middle incomeMoldovaMongoliaMontenegroMoroccoMozambiqueNamibiaNepalNetherlandsNew ZealandNicaraguaNigerNigeriaNorth AmericaNorwayOECD membersOmanPakistanPanamaParaguayPeruPhilippinesPolandPortugalPost-demographic dividendPre-demographic dividendPuerto RicoRomaniaRussian FederationRwandaSaudi ArabiaSenegalSerbiaSeychellesSierra LeoneSingaporeSlovak RepublicSloveniaSouth AfricaSouth AsiaSouth Asia (IDA & IBRD)South SudanSpainSri LankaSt. Kitts and NevisSt. LuciaSt. Vincent and the GrenadinesSub-Saharan Africa Sub-Saharan Africa (excluding high income)Sub-Saharan Africa (IDA & IBRD countries)SudanSurinameSwazilandSwedenSwitzerlandTajikistanTanzaniaThailandTimor-LesteTogoTongaTrinidad and TobagoTunisiaTurkeyTurkmenistanUgandaUkraineUnited Arab EmiratesUnited KingdomUnited StatesUpper middle incomeUruguayUzbekistanVanuatuVenezuela, RBVietnamWest Bank and GazaWorldYemen, Rep.ZambiaZimbabwe Timeline:
This timeline shows a graph from 1981 to 2016 of Equatorial Guinea. No data until 1980. Number of actual observations by date: 36.
Source name:
World Development Indicators
Source organization:
World Bank national accounts data, and OECD National Accounts data files.
Categories, topics:
Economy & Growth
Last updated:
apr 23, 2017
Indicators value changes by year
Minimum:
47.293 mln
jan 1, 1982
Maximum:
9.951 bln
jan 1, 2013
At the date of observation
Value
Absolute change
Change from previous value
jan 1, 1981
53.69 mln
+53.69 mln
0.0%
jan 1, 1982
47.293 mln
-6.398 mln
-11.92%
jan 1, 1983
122.943 mln
+75.65 mln
159.96%
jan 1, 1984
93.949 mln
-28.994 mln
-23.58%
jan 1, 1985
75.001 mln
-18.948 mln
-20.17%
jan 1, 1986
56.501 mln
-18.5 mln
-24.67%
jan 1, 1987
60.236 mln
+3.734 mln
6.61%
jan 1, 1988
77.625 mln
+17.389 mln
28.87%
jan 1, 1989
75.997 mln
-1.628 mln
-2.1%
jan 1, 1990
75.624 mln
-372.799K
-0.49%
jan 1, 1991
114.901 mln
+39.277 mln
51.94%
jan 1, 1992
95.563 mln
-19.338 mln
-16.83%
jan 1, 1993
98.837 mln
+3.275 mln
3.43%
jan 1, 1994
112.695 mln
+13.858 mln
14.02%
jan 1, 1995
182.981 mln
+70.286 mln
62.37%
jan 1, 1996
313.65 mln
+130.669 mln
71.41%
jan 1, 1997
722.109 mln
+408.459 mln
130.23%
jan 1, 1998
1.222 bln
+499.802 mln
69.21%
jan 1, 1999
2.233 bln
+1.012 bln
82.78%
jan 1, 2000
1.987 bln
-246.755 mln
-11.05%
jan 1, 2001
1.901 bln
-85.346 mln
-4.3%
jan 1, 2002
3.18 bln
+1.279 bln
67.25%
jan 1, 2003
1.463 bln
-1.717 bln
-54.01%
jan 1, 2004
3.604 bln
+2.142 bln
146.43%
jan 1, 2005
3.622 bln
+17.808 mln
0.49%
jan 1, 2006
2.941 bln
-680.872 mln
-18.8%
jan 1, 2007
3.751 bln
+809.419 mln
27.52%
jan 1, 2008
4.726 bln
+975.587 mln
26.01%
jan 1, 2009
6.251 bln
+1.525 bln
32.27%
jan 1, 2010
8.129 bln
+1.878 bln
30.05%
jan 1, 2011
6.898 bln
-1.232 bln
-15.15%
jan 1, 2012
7.57 bln
+672.479 mln
9.75%
jan 1, 2013
9.951 bln
+2.381 bln
31.45%
jan 1, 2014
6.081 bln
-3.87 bln
-38.89%
jan 1, 2015
5.609 bln
-472.121 mln
-7.76%
jan 1, 2016
2.764 bln
-2.845 bln
-50.72%
Ranking of countries by current statistics by years


Comments: