29
/
en
AIzaSyAYiBZKx7MnpbEhh9jyipgxe19OcubqV5w
April 1, 2024
253079
Sudan
SDN
true
2
1
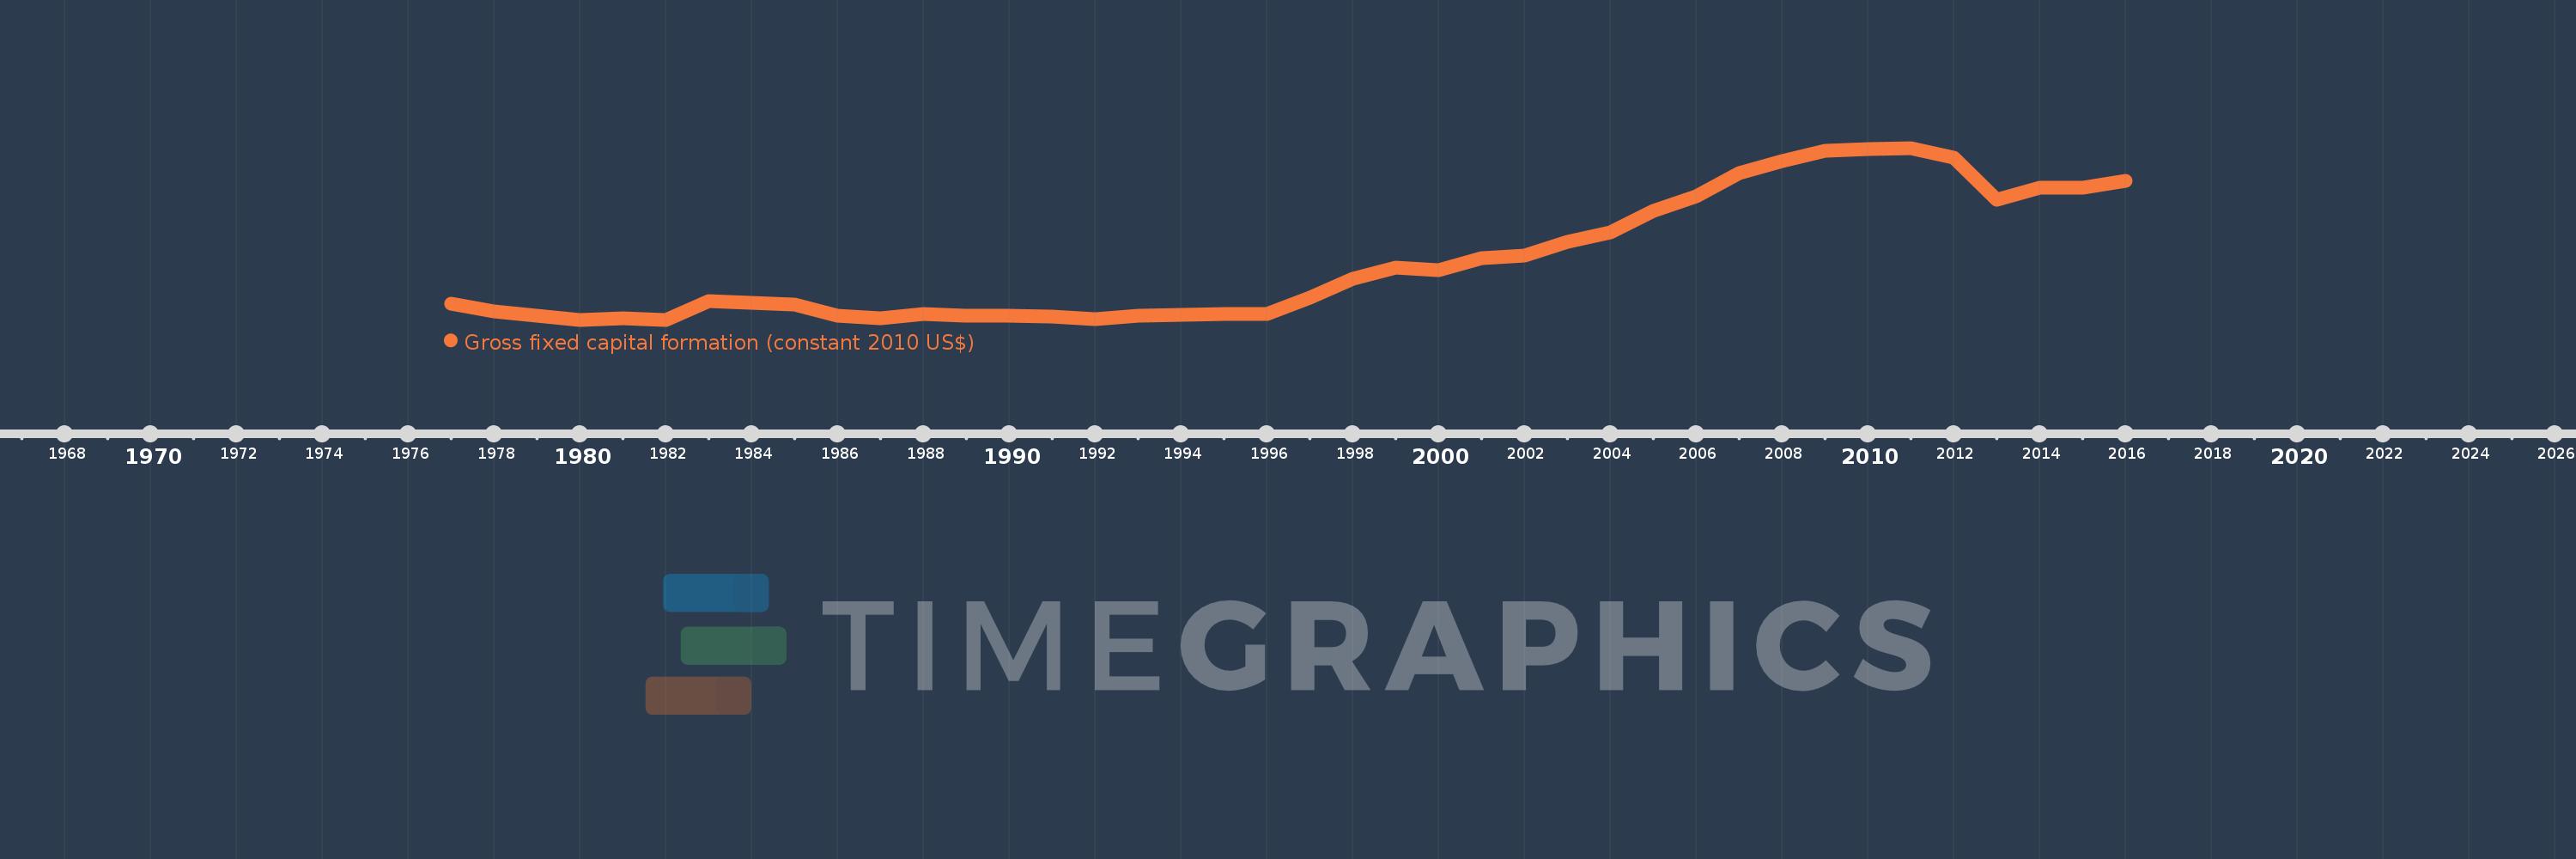
Gross fixed capital formation (constant 2010 US$)
2016,2015,2014,2013,2012,2011,2010,2009,2008,2007,2006,2005,2004,2003,2002,2001,2000,1999,1998,1997,1996,1995,1994,1993,1992,1991,1990,1989,1988,1987,1986,1985,1984,1983,1982,1981,1980,1979,1978,1977
This statistics in other country:
AfghanistanAlbaniaAlgeriaAngolaAntigua and BarbudaArab WorldArgentinaArmeniaAustraliaAustriaAzerbaijanBahamas, TheBahrainBangladeshBarbadosBelarusBelgiumBelizeBeninBermudaBhutanBoliviaBosnia and HerzegovinaBotswanaBrazilBrunei DarussalamBulgariaBurkina FasoBurundiCabo VerdeCambodiaCameroonCanadaCaribbean small statesCentral African RepublicCentral Europe and the BalticsChadChileChinaColombiaComorosCongo, Dem. Rep.Congo, Rep.Costa RicaCote d'IvoireCroatiaCubaCyprusCzech RepublicDenmarkDominicaDominican RepublicEarly-demographic dividendEast Asia & PacificEast Asia & Pacific (excluding high income)East Asia & Pacific (IDA & IBRD countries)EcuadorEgypt, Arab Rep.El SalvadorEquatorial GuineaEritreaEstoniaEuro areaEurope & Central AsiaEurope & Central Asia (excluding high income)Europe & Central Asia (IDA & IBRD countries)European UnionFinlandFragile and conflict affected situationsFranceGabonGambia, TheGeorgiaGermanyGhanaGreeceGrenadaGuatemalaGuineaGuinea-BissauGuyanaHaitiHeavily indebted poor countries (HIPC)High incomeHondurasHong Kong SAR, ChinaHungaryIBRD onlyIcelandIDA & IBRD totalIDA blendIDA onlyIDA totalIndiaIndonesiaIran, Islamic Rep.IraqIrelandIsraelItalyJamaicaJapanJordanKazakhstanKenyaKorea, Rep.KosovoKyrgyz RepublicLao PDRLate-demographic dividendLatin America & Caribbean Latin America & Caribbean (excluding high income)Latin America & the Caribbean (IDA & IBRD countries)LatviaLeast developed countries: UN classificationLebanonLiberiaLithuaniaLow & middle incomeLow incomeLower middle incomeLuxembourgMacao SAR, ChinaMacedonia, FYRMadagascarMalawiMalaysiaMaliMaltaMauritaniaMauritiusMexicoMiddle East & North AfricaMiddle East & North Africa (excluding high income)Middle East & North Africa (IDA & IBRD countries)Middle incomeMoldovaMongoliaMontenegroMoroccoMozambiqueNamibiaNepalNetherlandsNew ZealandNicaraguaNigerNigeriaNorth AmericaNorwayOECD membersOmanPakistanPanamaParaguayPeruPhilippinesPolandPortugalPost-demographic dividendPre-demographic dividendPuerto RicoRomaniaRussian FederationRwandaSaudi ArabiaSenegalSerbiaSeychellesSierra LeoneSingaporeSlovak RepublicSloveniaSouth AfricaSouth AsiaSouth Asia (IDA & IBRD)South SudanSpainSri LankaSt. Kitts and NevisSt. LuciaSt. Vincent and the GrenadinesSub-Saharan Africa Sub-Saharan Africa (excluding high income)Sub-Saharan Africa (IDA & IBRD countries)SudanSurinameSwazilandSwedenSwitzerlandTajikistanTanzaniaThailandTimor-LesteTogoTongaTrinidad and TobagoTunisiaTurkeyTurkmenistanUgandaUkraineUnited Arab EmiratesUnited KingdomUnited StatesUpper middle incomeUruguayUzbekistanVanuatuVenezuela, RBVietnamWest Bank and GazaWorldYemen, Rep.ZambiaZimbabwe Timeline:
This timeline shows a graph from 1977 to 2016 of Sudan. No data until 1976. Number of actual observations by date: 40.
Source name:
World Development Indicators
Source organization:
World Bank national accounts data, and OECD National Accounts data files.
Categories, topics:
Economy & Growth
Last updated:
apr 23, 2017
Indicators value changes by year
Minimum:
1.28 bln
jan 1, 1980
Maximum:
13.187 bln
jan 1, 2011
At the date of observation
Value
Absolute change
Change from previous value
jan 1, 1977
2.369 bln
+2.369 bln
0.0%
jan 1, 1978
1.858 bln
-511.265 mln
-21.58%
jan 1, 1979
1.541 bln
-316.449 mln
-17.04%
jan 1, 1980
1.28 bln
-260.701 mln
-16.92%
jan 1, 1981
1.371 bln
+90.414 mln
7.06%
jan 1, 1982
1.286 bln
-85.143 mln
-6.21%
jan 1, 1983
2.586 bln
+1.3 bln
101.1%
jan 1, 1984
2.433 bln
-152.244 mln
-5.89%
jan 1, 1985
2.336 bln
-97.509 mln
-4.01%
jan 1, 1986
1.548 bln
-787.372 mln
-33.71%
jan 1, 1987
1.387 bln
-161.569 mln
-10.43%
jan 1, 1988
1.704 bln
+317.665 mln
22.91%
jan 1, 1989
1.556 bln
-147.987 mln
-8.68%
jan 1, 1990
1.559 bln
+2.838 mln
0.18%
jan 1, 1991
1.471 bln
-88.387 mln
-5.67%
jan 1, 1992
1.296 bln
-175.152 mln
-11.91%
jan 1, 1993
1.585 bln
+289.364 mln
22.33%
jan 1, 1994
1.639 bln
+53.397 mln
3.37%
jan 1, 1995
1.65 bln
+11.844 mln
0.72%
jan 1, 1996
1.702 bln
+51.381 mln
3.11%
jan 1, 1997
2.814 bln
+1.112 bln
65.34%
jan 1, 1998
4.112 bln
+1.299 bln
46.15%
jan 1, 1999
4.905 bln
+792.973 mln
19.28%
jan 1, 2000
4.743 bln
-162.496 mln
-3.31%
jan 1, 2001
5.576 bln
+833.133 mln
17.57%
jan 1, 2002
5.705 bln
+128.956 mln
2.31%
jan 1, 2003
6.657 bln
+951.861 mln
16.68%
jan 1, 2004
7.34 bln
+683.588 mln
10.27%
jan 1, 2005
8.836 bln
+1.496 bln
20.37%
jan 1, 2006
9.859 bln
+1.023 bln
11.58%
jan 1, 2007
11.424 bln
+1.565 bln
15.87%
jan 1, 2008
12.264 bln
+839.882 mln
7.35%
jan 1, 2009
12.992 bln
+728.364 mln
5.94%
jan 1, 2010
13.135 bln
+142.915 mln
1.1%
jan 1, 2011
13.187 bln
+51.369 mln
0.39%
jan 1, 2012
12.525 bln
-661.773 mln
-5.02%
jan 1, 2013
9.624 bln
-2.901 bln
-23.16%
jan 1, 2014
10.425 bln
+801.248 mln
8.33%
jan 1, 2015
10.429 bln
+3.405 mln
0.03%
jan 1, 2016
10.898 bln
+469.291 mln
4.5%
Ranking of countries by current statistics by years


Comments: