29
/
en
AIzaSyAYiBZKx7MnpbEhh9jyipgxe19OcubqV5w
April 1, 2024
214370
Norway
NOR
true
2
1
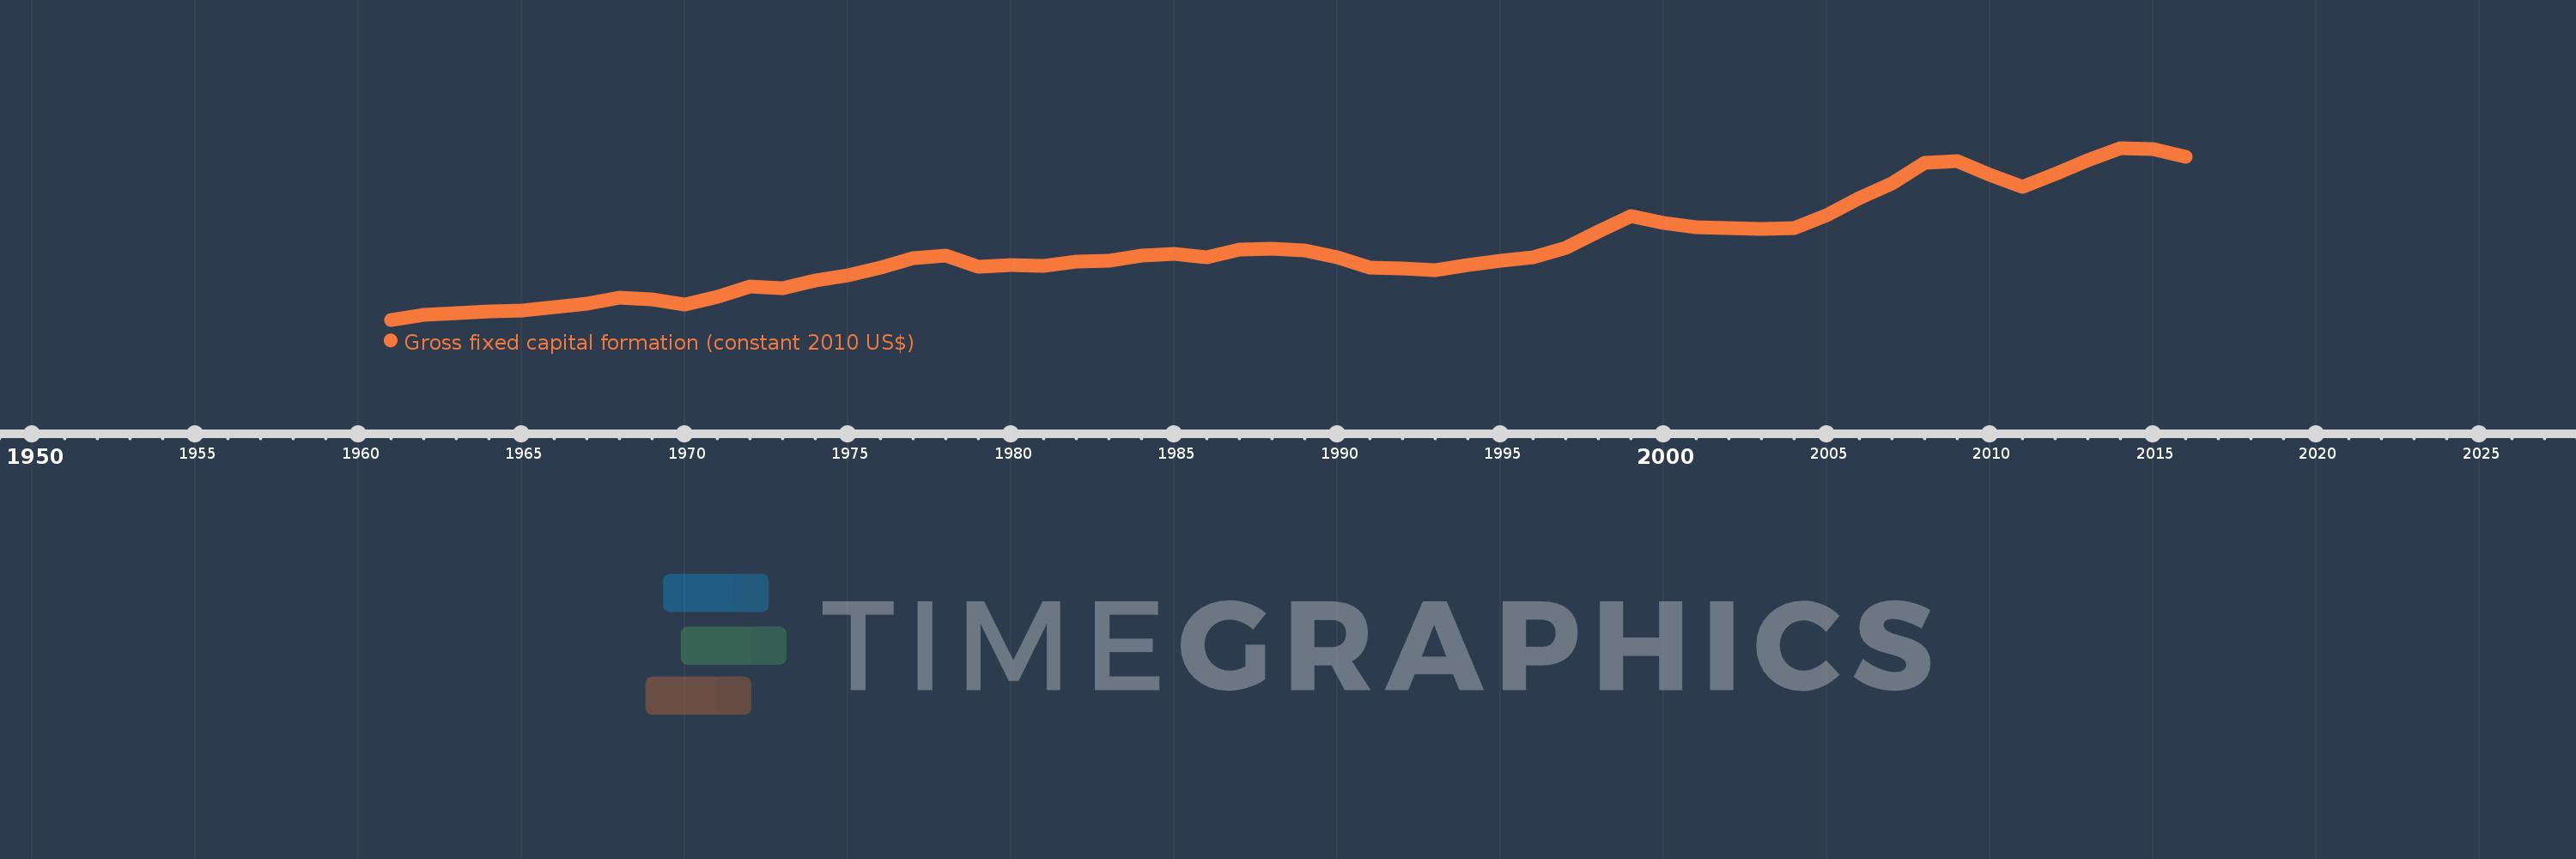
Gross fixed capital formation (constant 2010 US$)
2016,2015,2014,2013,2012,2011,2010,2009,2008,2007,2006,2005,2004,2003,2002,2001,2000,1999,1998,1997,1996,1995,1994,1993,1992,1991,1990,1989,1988,1987,1986,1985,1984,1983,1982,1981,1980,1979,1978,1977,1976,1975,1974,1973,1972,1971,1970,1969,1968,1967,1966,1965,1964,1963,1962,1961
This statistics in other country:
AfghanistanAlbaniaAlgeriaAngolaAntigua and BarbudaArab WorldArgentinaArmeniaAustraliaAustriaAzerbaijanBahamas, TheBahrainBangladeshBarbadosBelarusBelgiumBelizeBeninBermudaBhutanBoliviaBosnia and HerzegovinaBotswanaBrazilBrunei DarussalamBulgariaBurkina FasoBurundiCabo VerdeCambodiaCameroonCanadaCaribbean small statesCentral African RepublicCentral Europe and the BalticsChadChileChinaColombiaComorosCongo, Dem. Rep.Congo, Rep.Costa RicaCote d'IvoireCroatiaCubaCyprusCzech RepublicDenmarkDominicaDominican RepublicEarly-demographic dividendEast Asia & PacificEast Asia & Pacific (excluding high income)East Asia & Pacific (IDA & IBRD countries)EcuadorEgypt, Arab Rep.El SalvadorEquatorial GuineaEritreaEstoniaEuro areaEurope & Central AsiaEurope & Central Asia (excluding high income)Europe & Central Asia (IDA & IBRD countries)European UnionFinlandFragile and conflict affected situationsFranceGabonGambia, TheGeorgiaGermanyGhanaGreeceGrenadaGuatemalaGuineaGuinea-BissauGuyanaHaitiHeavily indebted poor countries (HIPC)High incomeHondurasHong Kong SAR, ChinaHungaryIBRD onlyIcelandIDA & IBRD totalIDA blendIDA onlyIDA totalIndiaIndonesiaIran, Islamic Rep.IraqIrelandIsraelItalyJamaicaJapanJordanKazakhstanKenyaKorea, Rep.KosovoKyrgyz RepublicLao PDRLate-demographic dividendLatin America & Caribbean Latin America & Caribbean (excluding high income)Latin America & the Caribbean (IDA & IBRD countries)LatviaLeast developed countries: UN classificationLebanonLiberiaLithuaniaLow & middle incomeLow incomeLower middle incomeLuxembourgMacao SAR, ChinaMacedonia, FYRMadagascarMalawiMalaysiaMaliMaltaMauritaniaMauritiusMexicoMiddle East & North AfricaMiddle East & North Africa (excluding high income)Middle East & North Africa (IDA & IBRD countries)Middle incomeMoldovaMongoliaMontenegroMoroccoMozambiqueNamibiaNepalNetherlandsNew ZealandNicaraguaNigerNigeriaNorth AmericaNorwayOECD membersOmanPakistanPanamaParaguayPeruPhilippinesPolandPortugalPost-demographic dividendPre-demographic dividendPuerto RicoRomaniaRussian FederationRwandaSaudi ArabiaSenegalSerbiaSeychellesSierra LeoneSingaporeSlovak RepublicSloveniaSouth AfricaSouth AsiaSouth Asia (IDA & IBRD)South SudanSpainSri LankaSt. Kitts and NevisSt. LuciaSt. Vincent and the GrenadinesSub-Saharan Africa Sub-Saharan Africa (excluding high income)Sub-Saharan Africa (IDA & IBRD countries)SudanSurinameSwazilandSwedenSwitzerlandTajikistanTanzaniaThailandTimor-LesteTogoTongaTrinidad and TobagoTunisiaTurkeyTurkmenistanUgandaUkraineUnited Arab EmiratesUnited KingdomUnited StatesUpper middle incomeUruguayUzbekistanVanuatuVenezuela, RBVietnamWest Bank and GazaWorldYemen, Rep.ZambiaZimbabwe Timeline:
This timeline shows a graph from 1961 to 2016 of Norway. No data until 1960. Number of actual observations by date: 56.
Source name:
World Development Indicators
Source organization:
World Bank national accounts data, and OECD National Accounts data files.
Categories, topics:
Economy & Growth
Last updated:
apr 23, 2017
Indicators value changes by year
Minimum:
19.636 bln
jan 1, 1961
Maximum:
108.314 bln
jan 1, 2014
At the date of observation
Value
Absolute change
Change from previous value
jan 1, 1961
19.636 bln
+19.636 bln
0.0%
jan 1, 1962
22.065 bln
+2.429 bln
12.37%
jan 1, 1963
22.929 bln
+864.433 mln
3.92%
jan 1, 1964
23.797 bln
+867.422 mln
3.78%
jan 1, 1965
24.582 bln
+785.303 mln
3.3%
jan 1, 1966
26.254 bln
+1.672 bln
6.8%
jan 1, 1967
27.808 bln
+1.554 bln
5.92%
jan 1, 1968
31.081 bln
+3.273 bln
11.77%
jan 1, 1969
30.132 bln
-949.363 mln
-3.05%
jan 1, 1970
27.547 bln
-2.585 bln
-8.58%
jan 1, 1971
31.645 bln
+4.098 bln
14.88%
jan 1, 1972
36.799 bln
+5.154 bln
16.29%
jan 1, 1973
35.85 bln
-948.744 mln
-2.58%
jan 1, 1974
40.044 bln
+4.194 bln
11.7%
jan 1, 1975
42.454 bln
+2.409 bln
6.02%
jan 1, 1976
46.643 bln
+4.189 bln
9.87%
jan 1, 1977
51.265 bln
+4.622 bln
9.91%
jan 1, 1978
52.825 bln
+1.56 bln
3.04%
jan 1, 1979
47.044 bln
-5.781 bln
-10.94%
jan 1, 1980
47.949 bln
+904.962 mln
1.92%
jan 1, 1981
47.374 bln
-575.07 mln
-1.2%
jan 1, 1982
49.761 bln
+2.388 bln
5.04%
jan 1, 1983
50.157 bln
+395.259 mln
0.79%
jan 1, 1984
52.917 bln
+2.76 bln
5.5%
jan 1, 1985
53.603 bln
+685.848 mln
1.3%
jan 1, 1986
51.907 bln
-1.696 bln
-3.16%
jan 1, 1987
55.748 bln
+3.841 bln
7.4%
jan 1, 1988
56.177 bln
+429.266 mln
0.77%
jan 1, 1989
55.61 bln
-567.332 mln
-1.01%
jan 1, 1990
51.859 bln
-3.751 bln
-6.75%
jan 1, 1991
46.511 bln
-5.348 bln
-10.31%
jan 1, 1992
46.326 bln
-184.699 mln
-0.4%
jan 1, 1993
45.413 bln
-913.514 mln
-1.97%
jan 1, 1994
47.799 bln
+2.387 bln
5.26%
jan 1, 1995
50.31 bln
+2.511 bln
5.25%
jan 1, 1996
51.934 bln
+1.624 bln
3.23%
jan 1, 1997
56.795 bln
+4.861 bln
9.36%
jan 1, 1998
65.178 bln
+8.383 bln
14.76%
jan 1, 1999
73.202 bln
+8.024 bln
12.31%
jan 1, 2000
69.594 bln
-3.608 bln
-4.93%
jan 1, 2001
67.305 bln
-2.289 bln
-3.29%
jan 1, 2002
66.892 bln
-412.364 mln
-0.61%
jan 1, 2003
66.655 bln
-237.644 mln
-0.36%
jan 1, 2004
66.892 bln
+237.644 mln
0.36%
jan 1, 2005
73.557 bln
+6.665 bln
9.96%
jan 1, 2006
82.361 bln
+8.804 bln
11.97%
jan 1, 2007
89.896 bln
+7.535 bln
9.15%
jan 1, 2008
100.434 bln
+10.538 bln
11.72%
jan 1, 2009
101.366 bln
+932.045 mln
0.93%
jan 1, 2010
94.481 bln
-6.885 bln
-6.79%
jan 1, 2011
88.191 bln
-6.29 bln
-6.66%
jan 1, 2012
94.7 bln
+6.509 bln
7.38%
jan 1, 2013
101.903 bln
+7.203 bln
7.61%
jan 1, 2014
108.314 bln
+6.41 bln
6.29%
jan 1, 2015
107.604 bln
-710.081 mln
-0.66%
jan 1, 2016
103.546 bln
-4.058 bln
-3.77%
Ranking of countries by current statistics by years


Comments: