29
/
en
AIzaSyAYiBZKx7MnpbEhh9jyipgxe19OcubqV5w
April 1, 2024
202981
Mozambique
MOZ
true
2
1
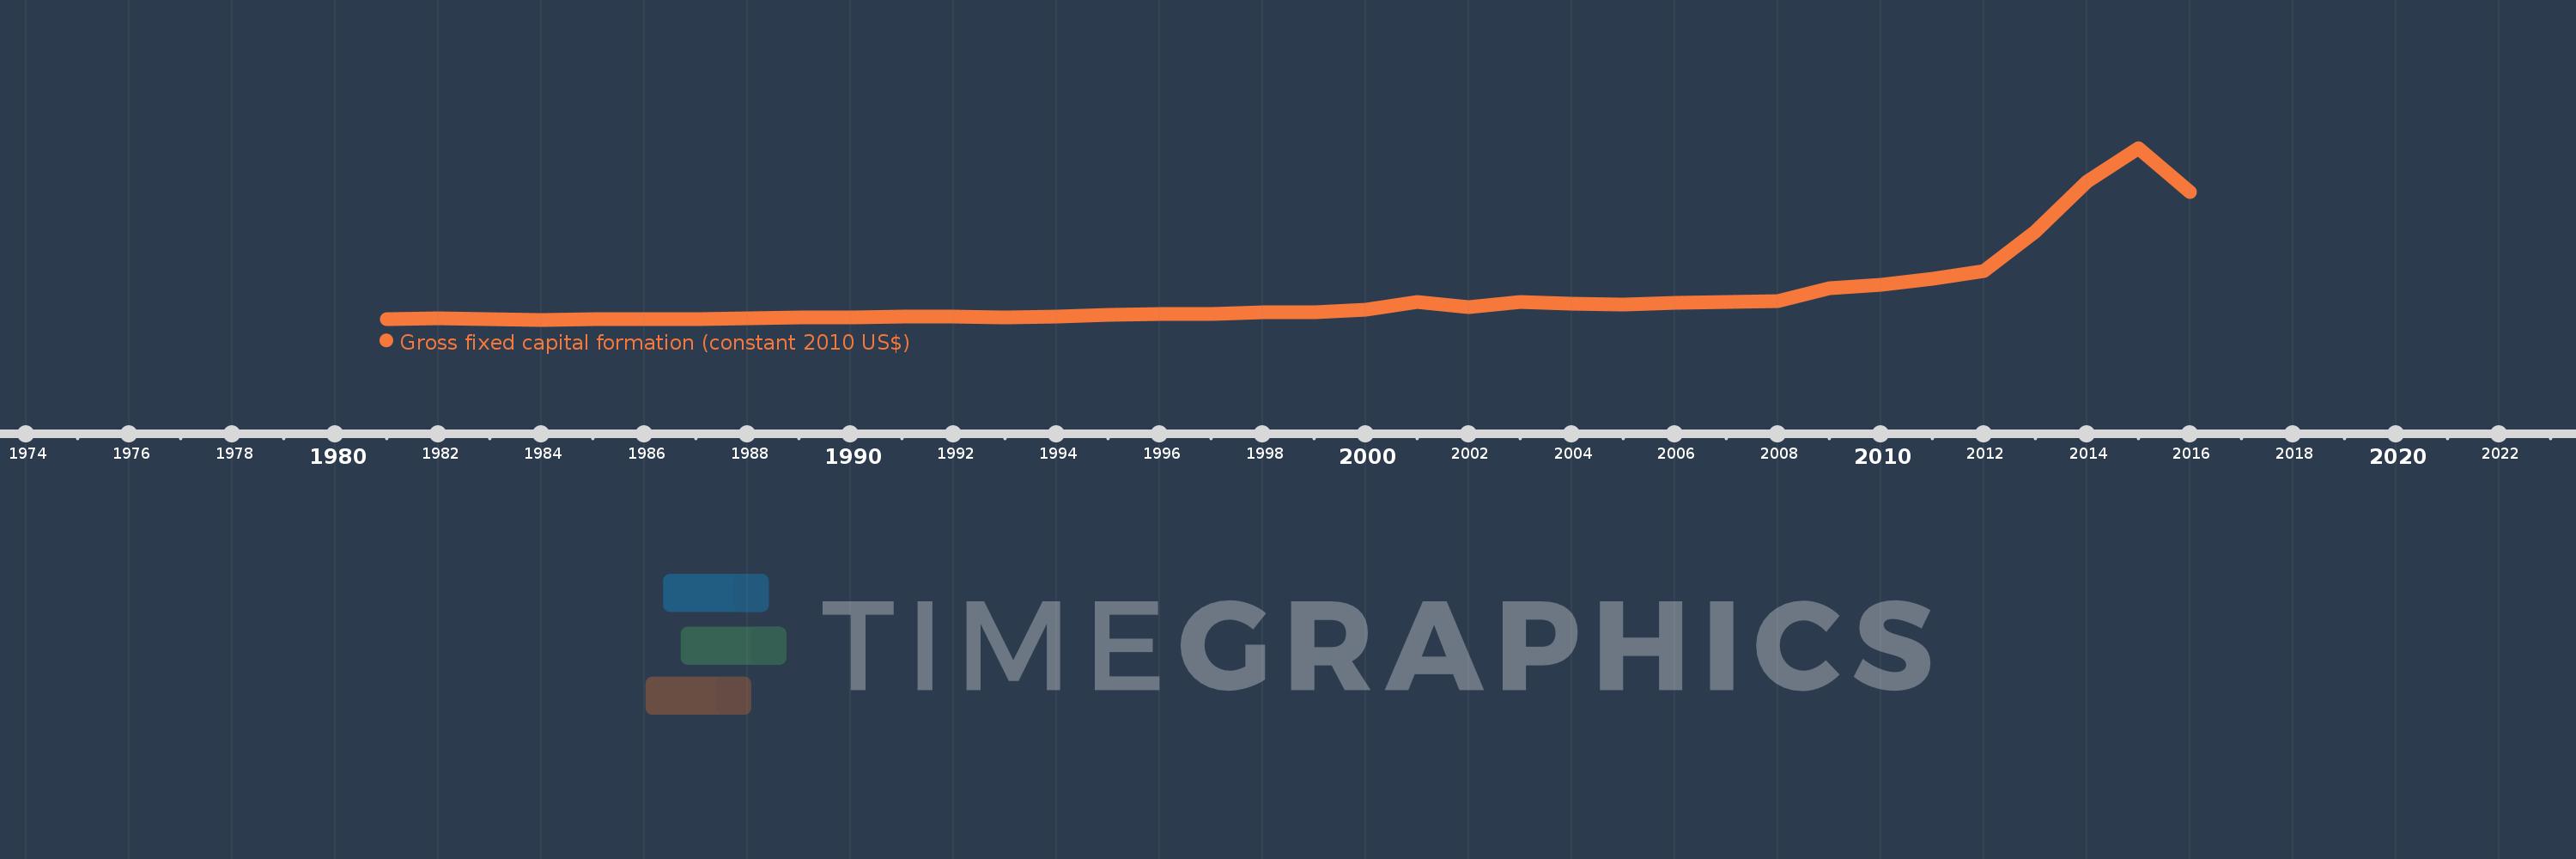
Gross fixed capital formation (constant 2010 US$)
2016,2015,2014,2013,2012,2011,2010,2009,2008,2007,2006,2005,2004,2003,2002,2001,2000,1999,1998,1997,1996,1995,1994,1993,1992,1991,1990,1989,1988,1987,1986,1985,1984,1983,1982,1981
This statistics in other country:
AfghanistanAlbaniaAlgeriaAngolaAntigua and BarbudaArab WorldArgentinaArmeniaAustraliaAustriaAzerbaijanBahamas, TheBahrainBangladeshBarbadosBelarusBelgiumBelizeBeninBermudaBhutanBoliviaBosnia and HerzegovinaBotswanaBrazilBrunei DarussalamBulgariaBurkina FasoBurundiCabo VerdeCambodiaCameroonCanadaCaribbean small statesCentral African RepublicCentral Europe and the BalticsChadChileChinaColombiaComorosCongo, Dem. Rep.Congo, Rep.Costa RicaCote d'IvoireCroatiaCubaCyprusCzech RepublicDenmarkDominicaDominican RepublicEarly-demographic dividendEast Asia & PacificEast Asia & Pacific (excluding high income)East Asia & Pacific (IDA & IBRD countries)EcuadorEgypt, Arab Rep.El SalvadorEquatorial GuineaEritreaEstoniaEuro areaEurope & Central AsiaEurope & Central Asia (excluding high income)Europe & Central Asia (IDA & IBRD countries)European UnionFinlandFragile and conflict affected situationsFranceGabonGambia, TheGeorgiaGermanyGhanaGreeceGrenadaGuatemalaGuineaGuinea-BissauGuyanaHaitiHeavily indebted poor countries (HIPC)High incomeHondurasHong Kong SAR, ChinaHungaryIBRD onlyIcelandIDA & IBRD totalIDA blendIDA onlyIDA totalIndiaIndonesiaIran, Islamic Rep.IraqIrelandIsraelItalyJamaicaJapanJordanKazakhstanKenyaKorea, Rep.KosovoKyrgyz RepublicLao PDRLate-demographic dividendLatin America & Caribbean Latin America & Caribbean (excluding high income)Latin America & the Caribbean (IDA & IBRD countries)LatviaLeast developed countries: UN classificationLebanonLiberiaLithuaniaLow & middle incomeLow incomeLower middle incomeLuxembourgMacao SAR, ChinaMacedonia, FYRMadagascarMalawiMalaysiaMaliMaltaMauritaniaMauritiusMexicoMiddle East & North AfricaMiddle East & North Africa (excluding high income)Middle East & North Africa (IDA & IBRD countries)Middle incomeMoldovaMongoliaMontenegroMoroccoMozambiqueNamibiaNepalNetherlandsNew ZealandNicaraguaNigerNigeriaNorth AmericaNorwayOECD membersOmanPakistanPanamaParaguayPeruPhilippinesPolandPortugalPost-demographic dividendPre-demographic dividendPuerto RicoRomaniaRussian FederationRwandaSaudi ArabiaSenegalSerbiaSeychellesSierra LeoneSingaporeSlovak RepublicSloveniaSouth AfricaSouth AsiaSouth Asia (IDA & IBRD)South SudanSpainSri LankaSt. Kitts and NevisSt. LuciaSt. Vincent and the GrenadinesSub-Saharan Africa Sub-Saharan Africa (excluding high income)Sub-Saharan Africa (IDA & IBRD countries)SudanSurinameSwazilandSwedenSwitzerlandTajikistanTanzaniaThailandTimor-LesteTogoTongaTrinidad and TobagoTunisiaTurkeyTurkmenistanUgandaUkraineUnited Arab EmiratesUnited KingdomUnited StatesUpper middle incomeUruguayUzbekistanVanuatuVenezuela, RBVietnamWest Bank and GazaWorldYemen, Rep.ZambiaZimbabwe Timeline:
This timeline shows a graph from 1981 to 2016 of Mozambique. No data until 1980. Number of actual observations by date: 36.
Source name:
World Development Indicators
Source organization:
World Bank national accounts data, and OECD National Accounts data files.
Categories, topics:
Economy & Growth
Last updated:
apr 23, 2017
Indicators value changes by year
Minimum:
166.964 mln
jan 1, 1984
Maximum:
7.011 bln
jan 1, 2015
At the date of observation
Value
Absolute change
Change from previous value
jan 1, 1981
203.456 mln
+203.456 mln
0.0%
jan 1, 1982
211.797 mln
+8.342 mln
4.1%
jan 1, 1983
202.872 mln
-8.925 mln
-4.21%
jan 1, 1984
166.964 mln
-35.908 mln
-17.7%
jan 1, 1985
188.669 mln
+21.705 mln
13.0%
jan 1, 1986
176.217 mln
-12.452 mln
-6.6%
jan 1, 1987
202.649 mln
+26.433 mln
15.0%
jan 1, 1988
233.655 mln
+31.005 mln
15.3%
jan 1, 1989
256.787 mln
+23.132 mln
9.9%
jan 1, 1990
271.937 mln
+15.15 mln
5.9%
jan 1, 1991
303.247 mln
+31.31 mln
11.51%
jan 1, 1992
292.824 mln
-10.423 mln
-3.44%
jan 1, 1993
272.599 mln
-20.225 mln
-6.91%
jan 1, 1994
283.668 mln
+11.068 mln
4.06%
jan 1, 1995
359.37 mln
+75.702 mln
26.69%
jan 1, 1996
393.178 mln
+33.808 mln
9.41%
jan 1, 1997
409.952 mln
+16.774 mln
4.27%
jan 1, 1998
476.807 mln
+66.856 mln
16.31%
jan 1, 1999
473.258 mln
-3.55 mln
-0.74%
jan 1, 2000
552.879 mln
+79.622 mln
16.82%
jan 1, 2001
864.644 mln
+311.764 mln
56.39%
jan 1, 2002
654.132 mln
-210.512 mln
-24.35%
jan 1, 2003
873.93 mln
+219.798 mln
33.6%
jan 1, 2004
805.864 mln
-68.065 mln
-7.79%
jan 1, 2005
760.67 mln
-45.194 mln
-5.61%
jan 1, 2006
837.934 mln
+77.264 mln
10.16%
jan 1, 2007
889.968 mln
+52.034 mln
6.21%
jan 1, 2008
922.435 mln
+32.467 mln
3.65%
jan 1, 2009
1.439 bln
+516.276 mln
55.97%
jan 1, 2010
1.543 bln
+104.221 mln
7.24%
jan 1, 2011
1.814 bln
+270.934 mln
17.56%
jan 1, 2012
2.124 bln
+310.365 mln
17.11%
jan 1, 2013
3.692 bln
+1.567 bln
73.79%
jan 1, 2014
5.654 bln
+1.963 bln
53.17%
jan 1, 2015
7.011 bln
+1.357 bln
23.99%
jan 1, 2016
5.267 bln
-1.744 bln
-24.88%
Ranking of countries by current statistics by years


Comments: