29
/
en
AIzaSyAYiBZKx7MnpbEhh9jyipgxe19OcubqV5w
April 1, 2024
124859
Egypt, Arab Rep.
EGY
true
2
1
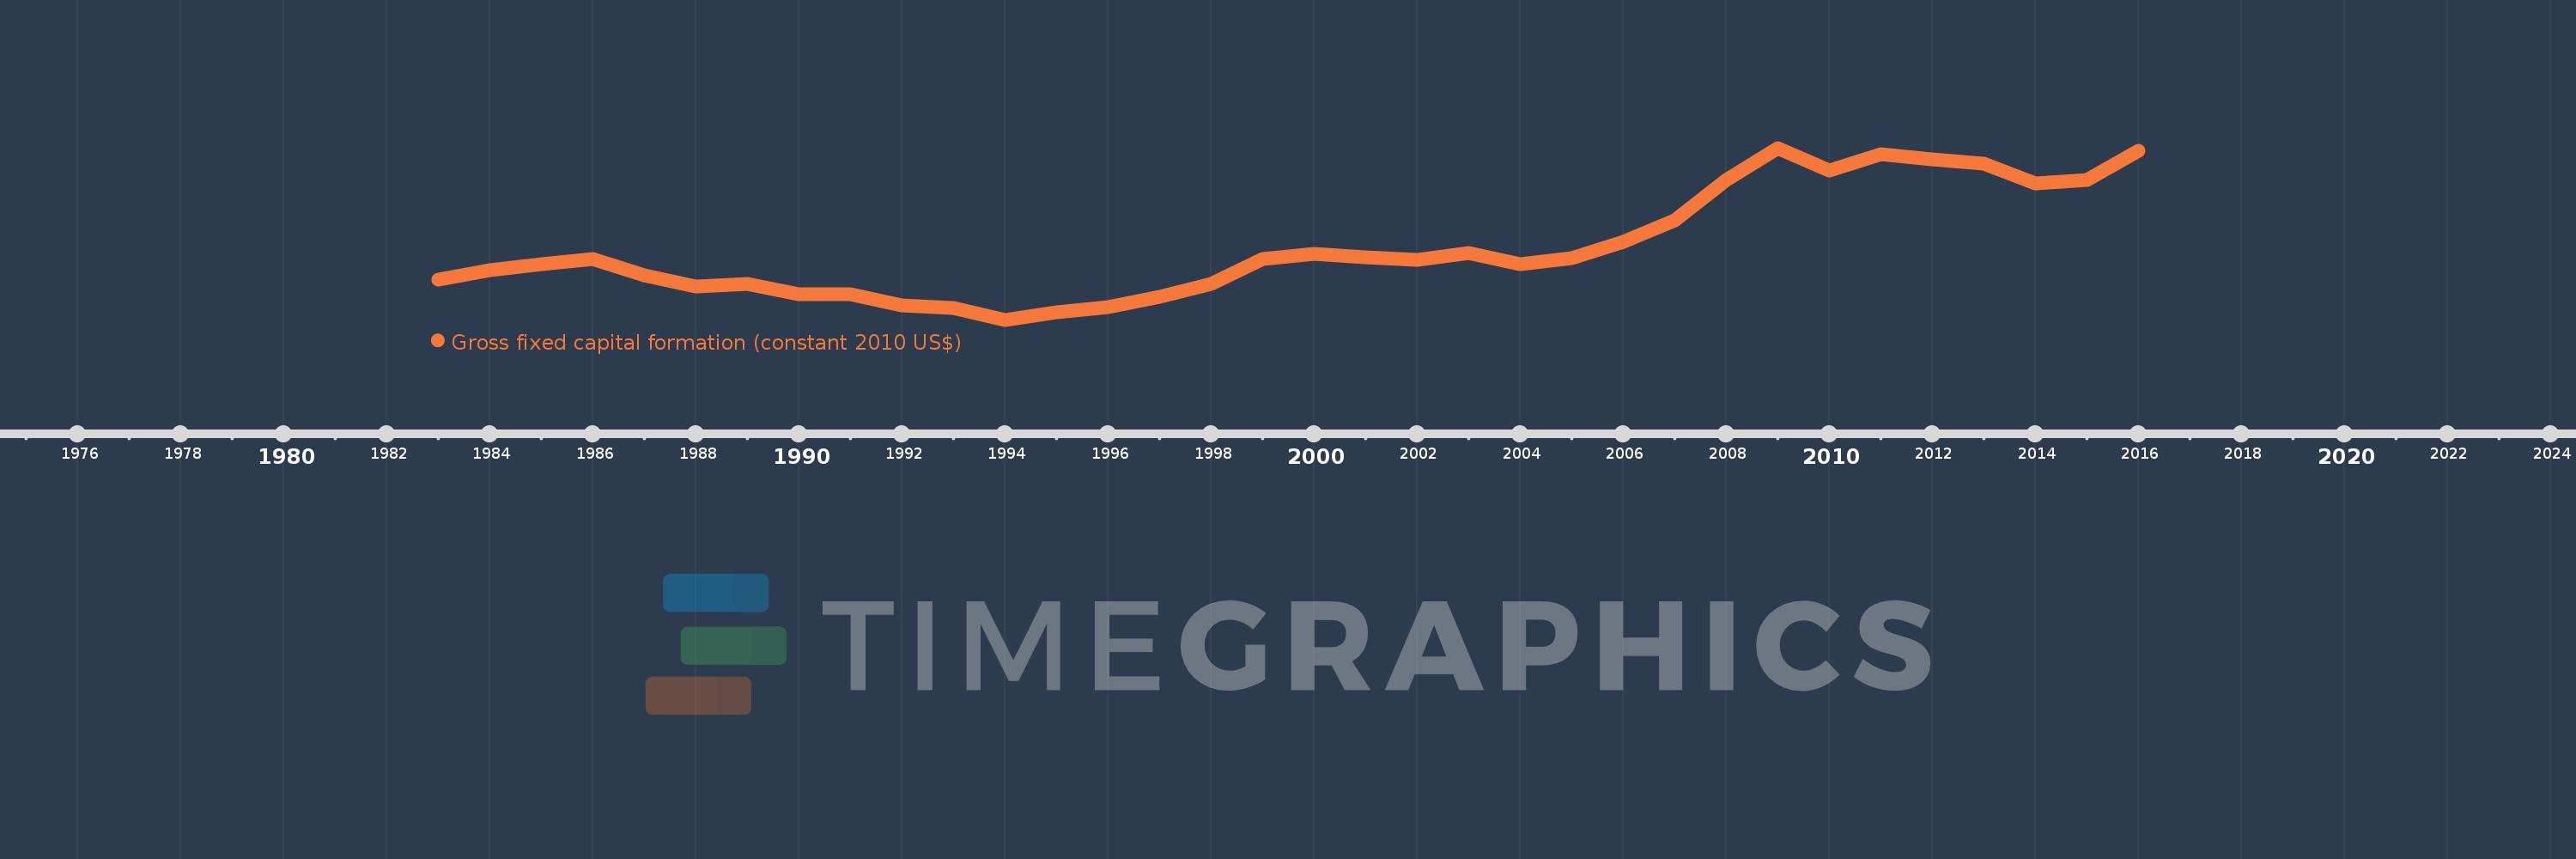
Gross fixed capital formation (constant 2010 US$)
2016,2015,2014,2013,2012,2011,2010,2009,2008,2007,2006,2005,2004,2003,2002,2001,2000,1999,1998,1997,1996,1995,1994,1993,1992,1991,1990,1989,1988,1987,1986,1985,1984,1983
This statistics in other country:
AfghanistanAlbaniaAlgeriaAngolaAntigua and BarbudaArab WorldArgentinaArmeniaAustraliaAustriaAzerbaijanBahamas, TheBahrainBangladeshBarbadosBelarusBelgiumBelizeBeninBermudaBhutanBoliviaBosnia and HerzegovinaBotswanaBrazilBrunei DarussalamBulgariaBurkina FasoBurundiCabo VerdeCambodiaCameroonCanadaCaribbean small statesCentral African RepublicCentral Europe and the BalticsChadChileChinaColombiaComorosCongo, Dem. Rep.Congo, Rep.Costa RicaCote d'IvoireCroatiaCubaCyprusCzech RepublicDenmarkDominicaDominican RepublicEarly-demographic dividendEast Asia & PacificEast Asia & Pacific (excluding high income)East Asia & Pacific (IDA & IBRD countries)EcuadorEgypt, Arab Rep.El SalvadorEquatorial GuineaEritreaEstoniaEuro areaEurope & Central AsiaEurope & Central Asia (excluding high income)Europe & Central Asia (IDA & IBRD countries)European UnionFinlandFragile and conflict affected situationsFranceGabonGambia, TheGeorgiaGermanyGhanaGreeceGrenadaGuatemalaGuineaGuinea-BissauGuyanaHaitiHeavily indebted poor countries (HIPC)High incomeHondurasHong Kong SAR, ChinaHungaryIBRD onlyIcelandIDA & IBRD totalIDA blendIDA onlyIDA totalIndiaIndonesiaIran, Islamic Rep.IraqIrelandIsraelItalyJamaicaJapanJordanKazakhstanKenyaKorea, Rep.KosovoKyrgyz RepublicLao PDRLate-demographic dividendLatin America & Caribbean Latin America & Caribbean (excluding high income)Latin America & the Caribbean (IDA & IBRD countries)LatviaLeast developed countries: UN classificationLebanonLiberiaLithuaniaLow & middle incomeLow incomeLower middle incomeLuxembourgMacao SAR, ChinaMacedonia, FYRMadagascarMalawiMalaysiaMaliMaltaMauritaniaMauritiusMexicoMiddle East & North AfricaMiddle East & North Africa (excluding high income)Middle East & North Africa (IDA & IBRD countries)Middle incomeMoldovaMongoliaMontenegroMoroccoMozambiqueNamibiaNepalNetherlandsNew ZealandNicaraguaNigerNigeriaNorth AmericaNorwayOECD membersOmanPakistanPanamaParaguayPeruPhilippinesPolandPortugalPost-demographic dividendPre-demographic dividendPuerto RicoRomaniaRussian FederationRwandaSaudi ArabiaSenegalSerbiaSeychellesSierra LeoneSingaporeSlovak RepublicSloveniaSouth AfricaSouth AsiaSouth Asia (IDA & IBRD)South SudanSpainSri LankaSt. Kitts and NevisSt. LuciaSt. Vincent and the GrenadinesSub-Saharan Africa Sub-Saharan Africa (excluding high income)Sub-Saharan Africa (IDA & IBRD countries)SudanSurinameSwazilandSwedenSwitzerlandTajikistanTanzaniaThailandTimor-LesteTogoTongaTrinidad and TobagoTunisiaTurkeyTurkmenistanUgandaUkraineUnited Arab EmiratesUnited KingdomUnited StatesUpper middle incomeUruguayUzbekistanVanuatuVenezuela, RBVietnamWest Bank and GazaWorldYemen, Rep.ZambiaZimbabwe Timeline:
This timeline shows a graph from 1983 to 2016 of Egypt, Arab Rep.. No data until 1982. Number of actual observations by date: 34.
Source name:
World Development Indicators
Source organization:
World Bank national accounts data, and OECD National Accounts data files.
Categories, topics:
Economy & Growth
Last updated:
apr 23, 2017
Indicators value changes by year
Minimum:
12.951 bln
jan 1, 1994
Maximum:
43.132 bln
jan 1, 2009
At the date of observation
Value
Absolute change
Change from previous value
jan 1, 1983
20.01 bln
+20.01 bln
0.0%
jan 1, 1984
21.716 bln
+1.706 bln
8.52%
jan 1, 1985
22.671 bln
+954.397 mln
4.39%
jan 1, 1986
23.612 bln
+941.449 mln
4.15%
jan 1, 1987
20.686 bln
-2.926 bln
-12.39%
jan 1, 1988
18.857 bln
-1.829 bln
-8.84%
jan 1, 1989
19.188 bln
+330.928 mln
1.75%
jan 1, 1990
17.47 bln
-1.718 bln
-8.95%
jan 1, 1991
17.359 bln
-110.707 mln
-0.63%
jan 1, 1992
15.546 bln
-1.813 bln
-10.44%
jan 1, 1993
14.949 bln
-596.498 mln
-3.84%
jan 1, 1994
12.951 bln
-1.999 bln
-13.37%
jan 1, 1995
14.3 bln
+1.349 bln
10.42%
jan 1, 1996
15.219 bln
+919.102 mln
6.43%
jan 1, 1997
16.948 bln
+1.729 bln
11.36%
jan 1, 1998
19.205 bln
+2.258 bln
13.32%
jan 1, 1999
23.56 bln
+4.355 bln
22.68%
jan 1, 2000
24.492 bln
+931.556 mln
3.95%
jan 1, 2001
23.928 bln
-563.796 mln
-2.3%
jan 1, 2002
23.405 bln
-522.668 mln
-2.18%
jan 1, 2003
24.693 bln
+1.288 bln
5.5%
jan 1, 2004
22.655 bln
-2.038 bln
-8.25%
jan 1, 2005
23.729 bln
+1.074 bln
4.74%
jan 1, 2006
26.684 bln
+2.955 bln
12.46%
jan 1, 2007
30.472 bln
+3.787 bln
14.19%
jan 1, 2008
37.506 bln
+7.035 bln
23.09%
jan 1, 2009
43.132 bln
+5.625 bln
15.0%
jan 1, 2010
39.099 bln
-4.032 bln
-9.35%
jan 1, 2011
42.056 bln
+2.956 bln
7.56%
jan 1, 2012
41.125 bln
-930.967 mln
-2.21%
jan 1, 2013
40.416 bln
-708.687 mln
-1.72%
jan 1, 2014
36.891 bln
-3.525 bln
-8.72%
jan 1, 2015
37.435 bln
+544.331 mln
1.48%
jan 1, 2016
42.61 bln
+5.175 bln
13.82%
Ranking of countries by current statistics by years


Comments: