29
/
en
AIzaSyAYiBZKx7MnpbEhh9jyipgxe19OcubqV5w
April 1, 2024
205327
Namibia
NAM
true
2
1
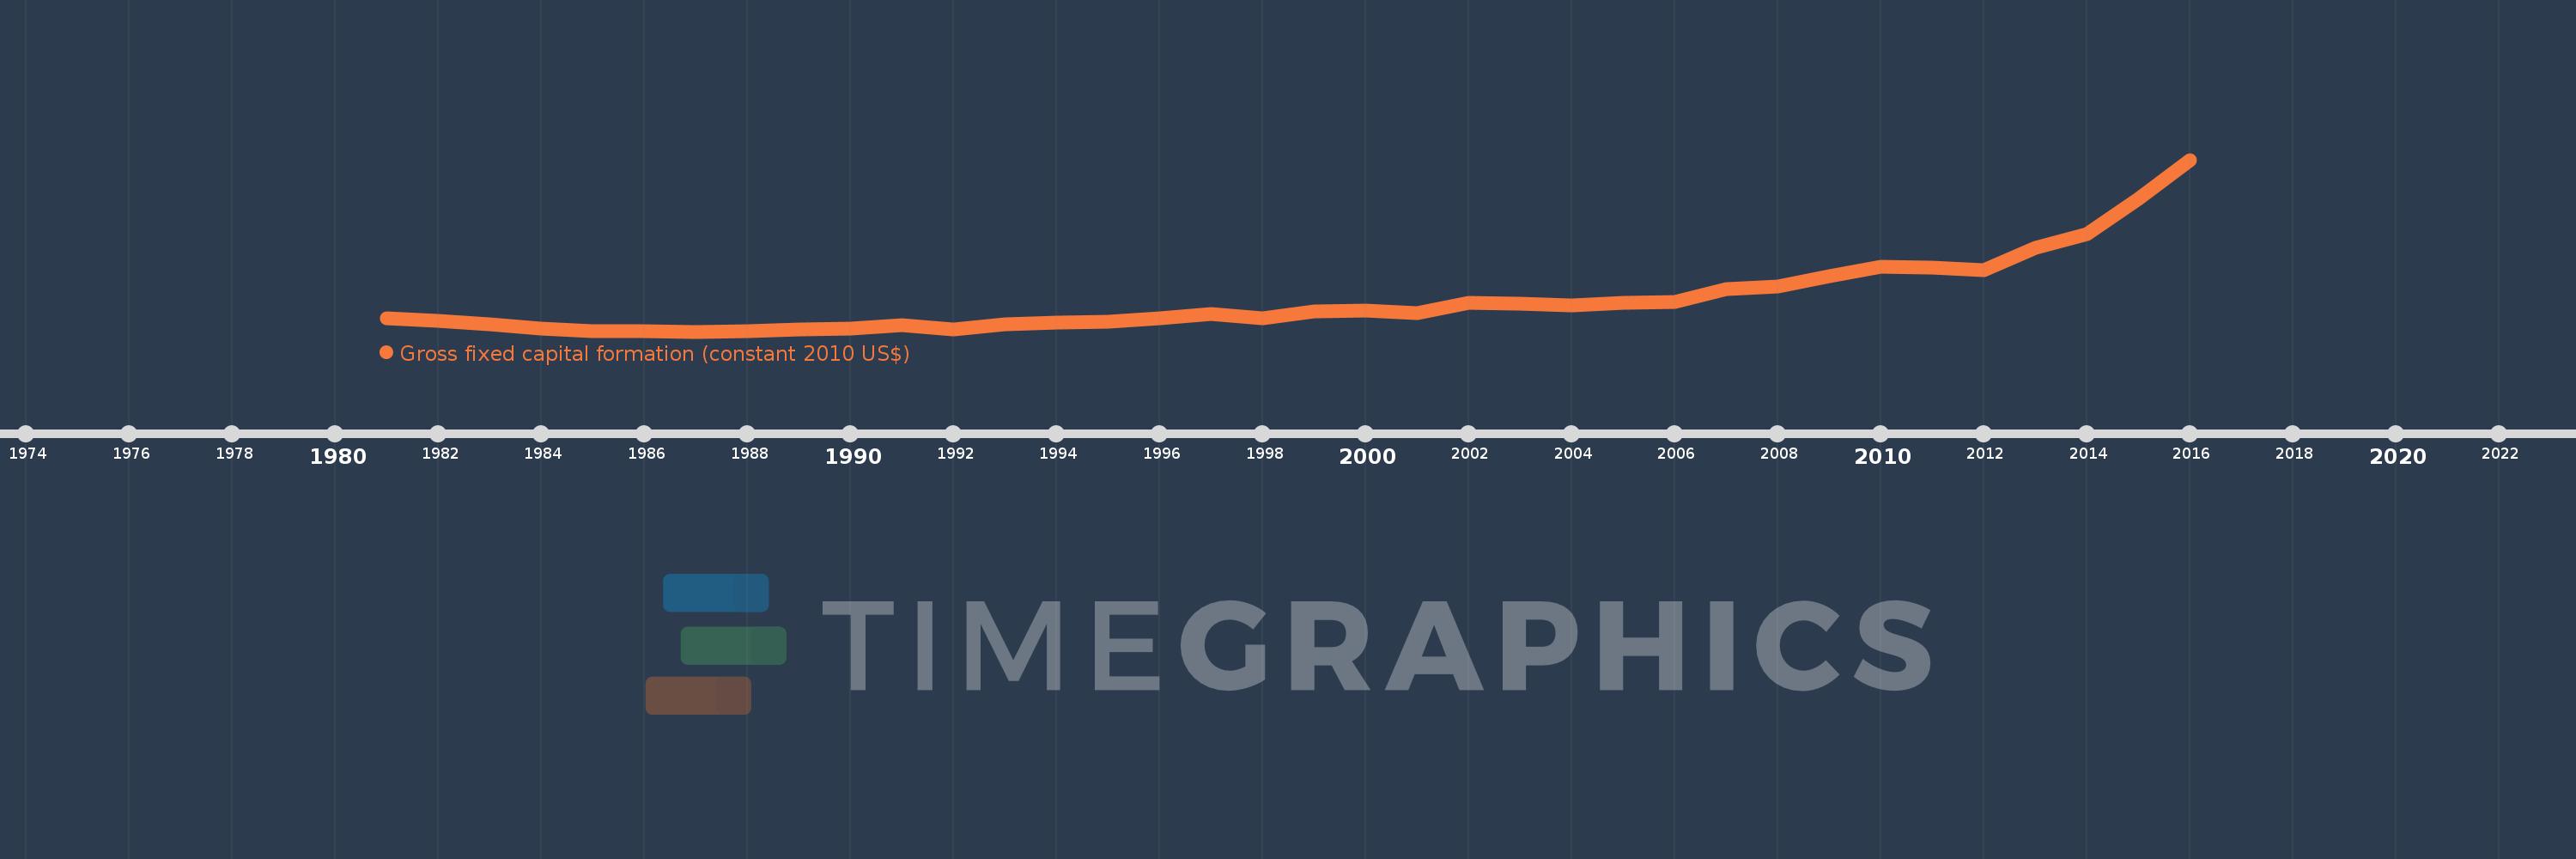
Gross fixed capital formation (constant 2010 US$)
2016,2015,2014,2013,2012,2011,2010,2009,2008,2007,2006,2005,2004,2003,2002,2001,2000,1999,1998,1997,1996,1995,1994,1993,1992,1991,1990,1989,1988,1987,1986,1985,1984,1983,1982,1981
This statistics in other country:
AfghanistanAlbaniaAlgeriaAngolaAntigua and BarbudaArab WorldArgentinaArmeniaAustraliaAustriaAzerbaijanBahamas, TheBahrainBangladeshBarbadosBelarusBelgiumBelizeBeninBermudaBhutanBoliviaBosnia and HerzegovinaBotswanaBrazilBrunei DarussalamBulgariaBurkina FasoBurundiCabo VerdeCambodiaCameroonCanadaCaribbean small statesCentral African RepublicCentral Europe and the BalticsChadChileChinaColombiaComorosCongo, Dem. Rep.Congo, Rep.Costa RicaCote d'IvoireCroatiaCubaCyprusCzech RepublicDenmarkDominicaDominican RepublicEarly-demographic dividendEast Asia & PacificEast Asia & Pacific (excluding high income)East Asia & Pacific (IDA & IBRD countries)EcuadorEgypt, Arab Rep.El SalvadorEquatorial GuineaEritreaEstoniaEuro areaEurope & Central AsiaEurope & Central Asia (excluding high income)Europe & Central Asia (IDA & IBRD countries)European UnionFinlandFragile and conflict affected situationsFranceGabonGambia, TheGeorgiaGermanyGhanaGreeceGrenadaGuatemalaGuineaGuinea-BissauGuyanaHaitiHeavily indebted poor countries (HIPC)High incomeHondurasHong Kong SAR, ChinaHungaryIBRD onlyIcelandIDA & IBRD totalIDA blendIDA onlyIDA totalIndiaIndonesiaIran, Islamic Rep.IraqIrelandIsraelItalyJamaicaJapanJordanKazakhstanKenyaKorea, Rep.KosovoKyrgyz RepublicLao PDRLate-demographic dividendLatin America & Caribbean Latin America & Caribbean (excluding high income)Latin America & the Caribbean (IDA & IBRD countries)LatviaLeast developed countries: UN classificationLebanonLiberiaLithuaniaLow & middle incomeLow incomeLower middle incomeLuxembourgMacao SAR, ChinaMacedonia, FYRMadagascarMalawiMalaysiaMaliMaltaMauritaniaMauritiusMexicoMiddle East & North AfricaMiddle East & North Africa (excluding high income)Middle East & North Africa (IDA & IBRD countries)Middle incomeMoldovaMongoliaMontenegroMoroccoMozambiqueNamibiaNepalNetherlandsNew ZealandNicaraguaNigerNigeriaNorth AmericaNorwayOECD membersOmanPakistanPanamaParaguayPeruPhilippinesPolandPortugalPost-demographic dividendPre-demographic dividendPuerto RicoRomaniaRussian FederationRwandaSaudi ArabiaSenegalSerbiaSeychellesSierra LeoneSingaporeSlovak RepublicSloveniaSouth AfricaSouth AsiaSouth Asia (IDA & IBRD)South SudanSpainSri LankaSt. Kitts and NevisSt. LuciaSt. Vincent and the GrenadinesSub-Saharan Africa Sub-Saharan Africa (excluding high income)Sub-Saharan Africa (IDA & IBRD countries)SudanSurinameSwazilandSwedenSwitzerlandTajikistanTanzaniaThailandTimor-LesteTogoTongaTrinidad and TobagoTunisiaTurkeyTurkmenistanUgandaUkraineUnited Arab EmiratesUnited KingdomUnited StatesUpper middle incomeUruguayUzbekistanVanuatuVenezuela, RBVietnamWest Bank and GazaWorldYemen, Rep.ZambiaZimbabwe Timeline:
This timeline shows a graph from 1981 to 2016 of Namibia. No data until 1980. Number of actual observations by date: 36.
Source name:
World Development Indicators
Source organization:
World Bank national accounts data, and OECD National Accounts data files.
Categories, topics:
Economy & Growth
Last updated:
apr 23, 2017
Indicators value changes by year
Minimum:
421.721 mln
jan 1, 1987
Maximum:
6.91 bln
jan 1, 2016
At the date of observation
Value
Absolute change
Change from previous value
jan 1, 1981
922.272 mln
+922.272 mln
0.0%
jan 1, 1982
836.678 mln
-85.594 mln
-9.28%
jan 1, 1983
689.99 mln
-146.688 mln
-17.53%
jan 1, 1984
523.062 mln
-166.928 mln
-24.19%
jan 1, 1985
448.656 mln
-74.406 mln
-14.23%
jan 1, 1986
451.879 mln
+3.223 mln
0.72%
jan 1, 1987
421.721 mln
-30.158 mln
-6.67%
jan 1, 1988
441.756 mln
+20.035 mln
4.75%
jan 1, 1989
498.114 mln
+56.358 mln
12.76%
jan 1, 1990
545.153 mln
+47.039 mln
9.44%
jan 1, 1991
658.559 mln
+113.406 mln
20.8%
jan 1, 1992
509.421 mln
-149.138 mln
-22.65%
jan 1, 1993
711.95 mln
+202.529 mln
39.76%
jan 1, 1994
751.377 mln
+39.428 mln
5.54%
jan 1, 1995
802.283 mln
+50.905 mln
6.77%
jan 1, 1996
923.64 mln
+121.357 mln
15.13%
jan 1, 1997
1.084 bln
+160.335 mln
17.36%
jan 1, 1998
939.79 mln
-144.185 mln
-13.3%
jan 1, 1999
1.169 bln
+228.738 mln
24.34%
jan 1, 2000
1.218 bln
+49.055 mln
4.2%
jan 1, 2001
1.108 bln
-109.675 mln
-9.01%
jan 1, 2002
1.499 bln
+390.927 mln
35.29%
jan 1, 2003
1.487 bln
-11.6 mln
-0.77%
jan 1, 2004
1.413 bln
-74.243 mln
-4.99%
jan 1, 2005
1.501 bln
+87.905 mln
6.22%
jan 1, 2006
1.555 bln
+53.943 mln
3.59%
jan 1, 2007
2.018 bln
+463.155 mln
29.79%
jan 1, 2008
2.137 bln
+119.278 mln
5.91%
jan 1, 2009
2.522 bln
+384.611 mln
18.0%
jan 1, 2010
2.887 bln
+365.26 mln
14.48%
jan 1, 2011
2.853 bln
-34.575 mln
-1.2%
jan 1, 2012
2.728 bln
-124.458 mln
-4.36%
jan 1, 2013
3.579 bln
+851.214 mln
31.2%
jan 1, 2014
4.099 bln
+519.458 mln
14.51%
jan 1, 2015
5.442 bln
+1.343 bln
32.78%
jan 1, 2016
6.91 bln
+1.468 bln
26.98%
Ranking of countries by current statistics by years


Comments: