29
/
en
AIzaSyAYiBZKx7MnpbEhh9jyipgxe19OcubqV5w
April 1, 2024
110997
Congo, Rep.
COG
true
2
1
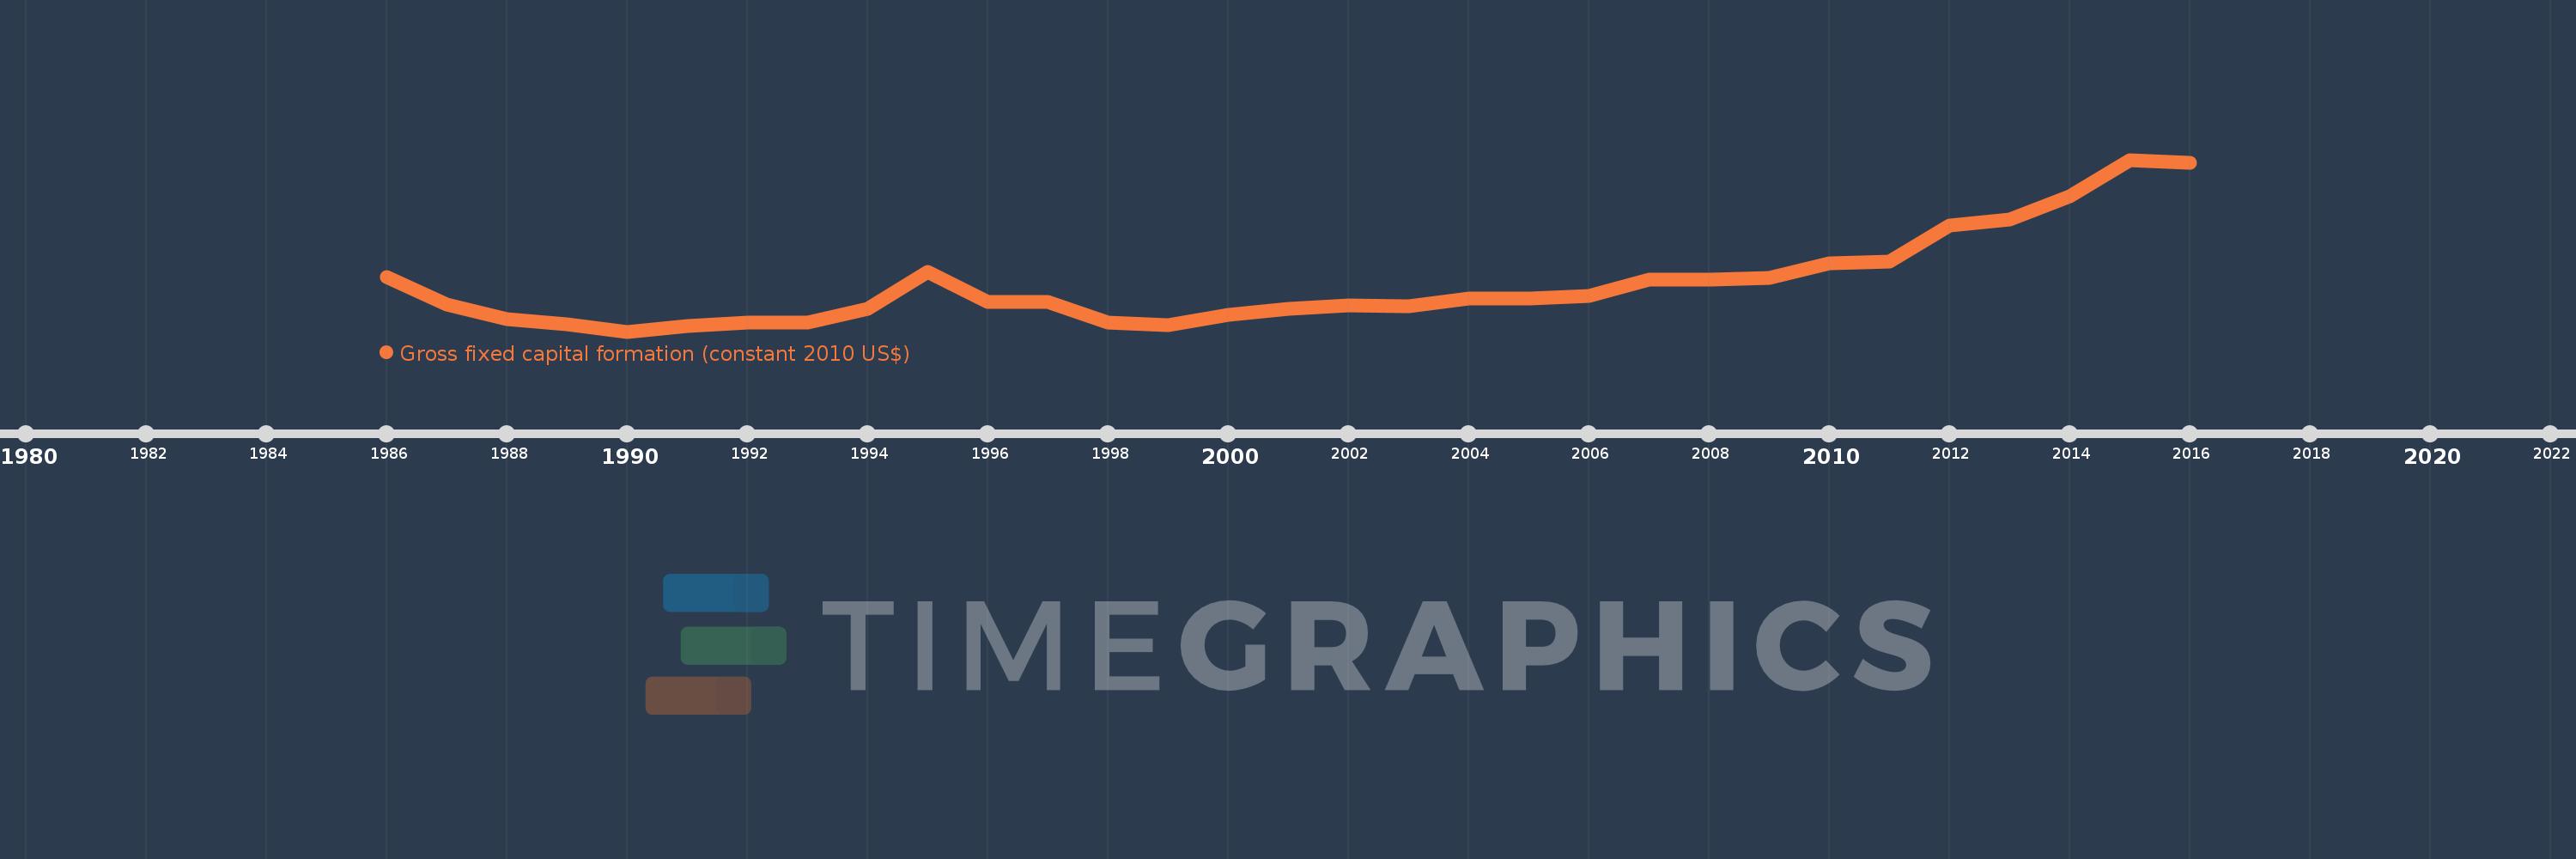
Gross fixed capital formation (constant 2010 US$)
2016,2015,2014,2013,2012,2011,2010,2009,2008,2007,2006,2005,2004,2003,2002,2001,2000,1999,1998,1997,1996,1995,1994,1993,1992,1991,1990,1989,1988,1987,1986
This statistics in other country:
AfghanistanAlbaniaAlgeriaAngolaAntigua and BarbudaArab WorldArgentinaArmeniaAustraliaAustriaAzerbaijanBahamas, TheBahrainBangladeshBarbadosBelarusBelgiumBelizeBeninBermudaBhutanBoliviaBosnia and HerzegovinaBotswanaBrazilBrunei DarussalamBulgariaBurkina FasoBurundiCabo VerdeCambodiaCameroonCanadaCaribbean small statesCentral African RepublicCentral Europe and the BalticsChadChileChinaColombiaComorosCongo, Dem. Rep.Congo, Rep.Costa RicaCote d'IvoireCroatiaCubaCyprusCzech RepublicDenmarkDominicaDominican RepublicEarly-demographic dividendEast Asia & PacificEast Asia & Pacific (excluding high income)East Asia & Pacific (IDA & IBRD countries)EcuadorEgypt, Arab Rep.El SalvadorEquatorial GuineaEritreaEstoniaEuro areaEurope & Central AsiaEurope & Central Asia (excluding high income)Europe & Central Asia (IDA & IBRD countries)European UnionFinlandFragile and conflict affected situationsFranceGabonGambia, TheGeorgiaGermanyGhanaGreeceGrenadaGuatemalaGuineaGuinea-BissauGuyanaHaitiHeavily indebted poor countries (HIPC)High incomeHondurasHong Kong SAR, ChinaHungaryIBRD onlyIcelandIDA & IBRD totalIDA blendIDA onlyIDA totalIndiaIndonesiaIran, Islamic Rep.IraqIrelandIsraelItalyJamaicaJapanJordanKazakhstanKenyaKorea, Rep.KosovoKyrgyz RepublicLao PDRLate-demographic dividendLatin America & Caribbean Latin America & Caribbean (excluding high income)Latin America & the Caribbean (IDA & IBRD countries)LatviaLeast developed countries: UN classificationLebanonLiberiaLithuaniaLow & middle incomeLow incomeLower middle incomeLuxembourgMacao SAR, ChinaMacedonia, FYRMadagascarMalawiMalaysiaMaliMaltaMauritaniaMauritiusMexicoMiddle East & North AfricaMiddle East & North Africa (excluding high income)Middle East & North Africa (IDA & IBRD countries)Middle incomeMoldovaMongoliaMontenegroMoroccoMozambiqueNamibiaNepalNetherlandsNew ZealandNicaraguaNigerNigeriaNorth AmericaNorwayOECD membersOmanPakistanPanamaParaguayPeruPhilippinesPolandPortugalPost-demographic dividendPre-demographic dividendPuerto RicoRomaniaRussian FederationRwandaSaudi ArabiaSenegalSerbiaSeychellesSierra LeoneSingaporeSlovak RepublicSloveniaSouth AfricaSouth AsiaSouth Asia (IDA & IBRD)South SudanSpainSri LankaSt. Kitts and NevisSt. LuciaSt. Vincent and the GrenadinesSub-Saharan Africa Sub-Saharan Africa (excluding high income)Sub-Saharan Africa (IDA & IBRD countries)SudanSurinameSwazilandSwedenSwitzerlandTajikistanTanzaniaThailandTimor-LesteTogoTongaTrinidad and TobagoTunisiaTurkeyTurkmenistanUgandaUkraineUnited Arab EmiratesUnited KingdomUnited StatesUpper middle incomeUruguayUzbekistanVanuatuVenezuela, RBVietnamWest Bank and GazaWorldYemen, Rep.ZambiaZimbabwe Timeline:
This timeline shows a graph from 1986 to 2016 of Congo, Rep.. No data until 1985. Number of actual observations by date: 31.
Source name:
World Development Indicators
Source organization:
World Bank national accounts data, and OECD National Accounts data files.
Categories, topics:
Economy & Growth
Last updated:
apr 23, 2017
Indicators value changes by year
Minimum:
685.42 mln
jan 1, 1990
Maximum:
4.965 bln
jan 1, 2015
At the date of observation
Value
Absolute change
Change from previous value
jan 1, 1986
2.048 bln
+2.048 bln
0.0%
jan 1, 1987
1.355 bln
-692.486 mln
-33.82%
jan 1, 1988
1.006 bln
-349.069 mln
-25.76%
jan 1, 1989
857.835 mln
-148.39 mln
-14.75%
jan 1, 1990
685.42 mln
-172.415 mln
-20.1%
jan 1, 1991
829.358 mln
+143.938 mln
21.0%
jan 1, 1992
920.429 mln
+91.071 mln
10.98%
jan 1, 1993
917.689 mln
-2.741 mln
-0.3%
jan 1, 1994
1.248 bln
+330.464 mln
36.01%
jan 1, 1995
2.165 bln
+916.956 mln
73.47%
jan 1, 1996
1.434 bln
-731.422 mln
-33.78%
jan 1, 1997
1.43 bln
-3.754 mln
-0.26%
jan 1, 1998
909.105 mln
-520.829 mln
-36.42%
jan 1, 1999
850.423 mln
-58.683 mln
-6.45%
jan 1, 2000
1.093 bln
+242.334 mln
28.5%
jan 1, 2001
1.256 bln
+162.919 mln
14.91%
jan 1, 2002
1.336 bln
+80.191 mln
6.39%
jan 1, 2003
1.307 bln
-29.288 mln
-2.19%
jan 1, 2004
1.504 bln
+197.035 mln
15.08%
jan 1, 2005
1.505 bln
+1.636 mln
0.11%
jan 1, 2006
1.582 bln
+76.911 mln
5.11%
jan 1, 2007
1.988 bln
+405.35 mln
25.62%
jan 1, 2008
1.982 bln
-5.935 mln
-0.3%
jan 1, 2009
2.032 bln
+50.418 mln
2.54%
jan 1, 2010
2.378 bln
+345.815 mln
17.02%
jan 1, 2011
2.434 bln
+56.304 mln
2.37%
jan 1, 2012
3.337 bln
+902.476 mln
37.08%
jan 1, 2013
3.468 bln
+131.295 mln
3.94%
jan 1, 2014
4.048 bln
+579.718 mln
16.72%
jan 1, 2015
4.965 bln
+917.819 mln
22.68%
jan 1, 2016
4.881 bln
-84.412 mln
-1.7%
Ranking of countries by current statistics by years


Comments: