29
/
en
AIzaSyAYiBZKx7MnpbEhh9jyipgxe19OcubqV5w
April 1, 2024
116948
Cyprus
CYP
true
2
1
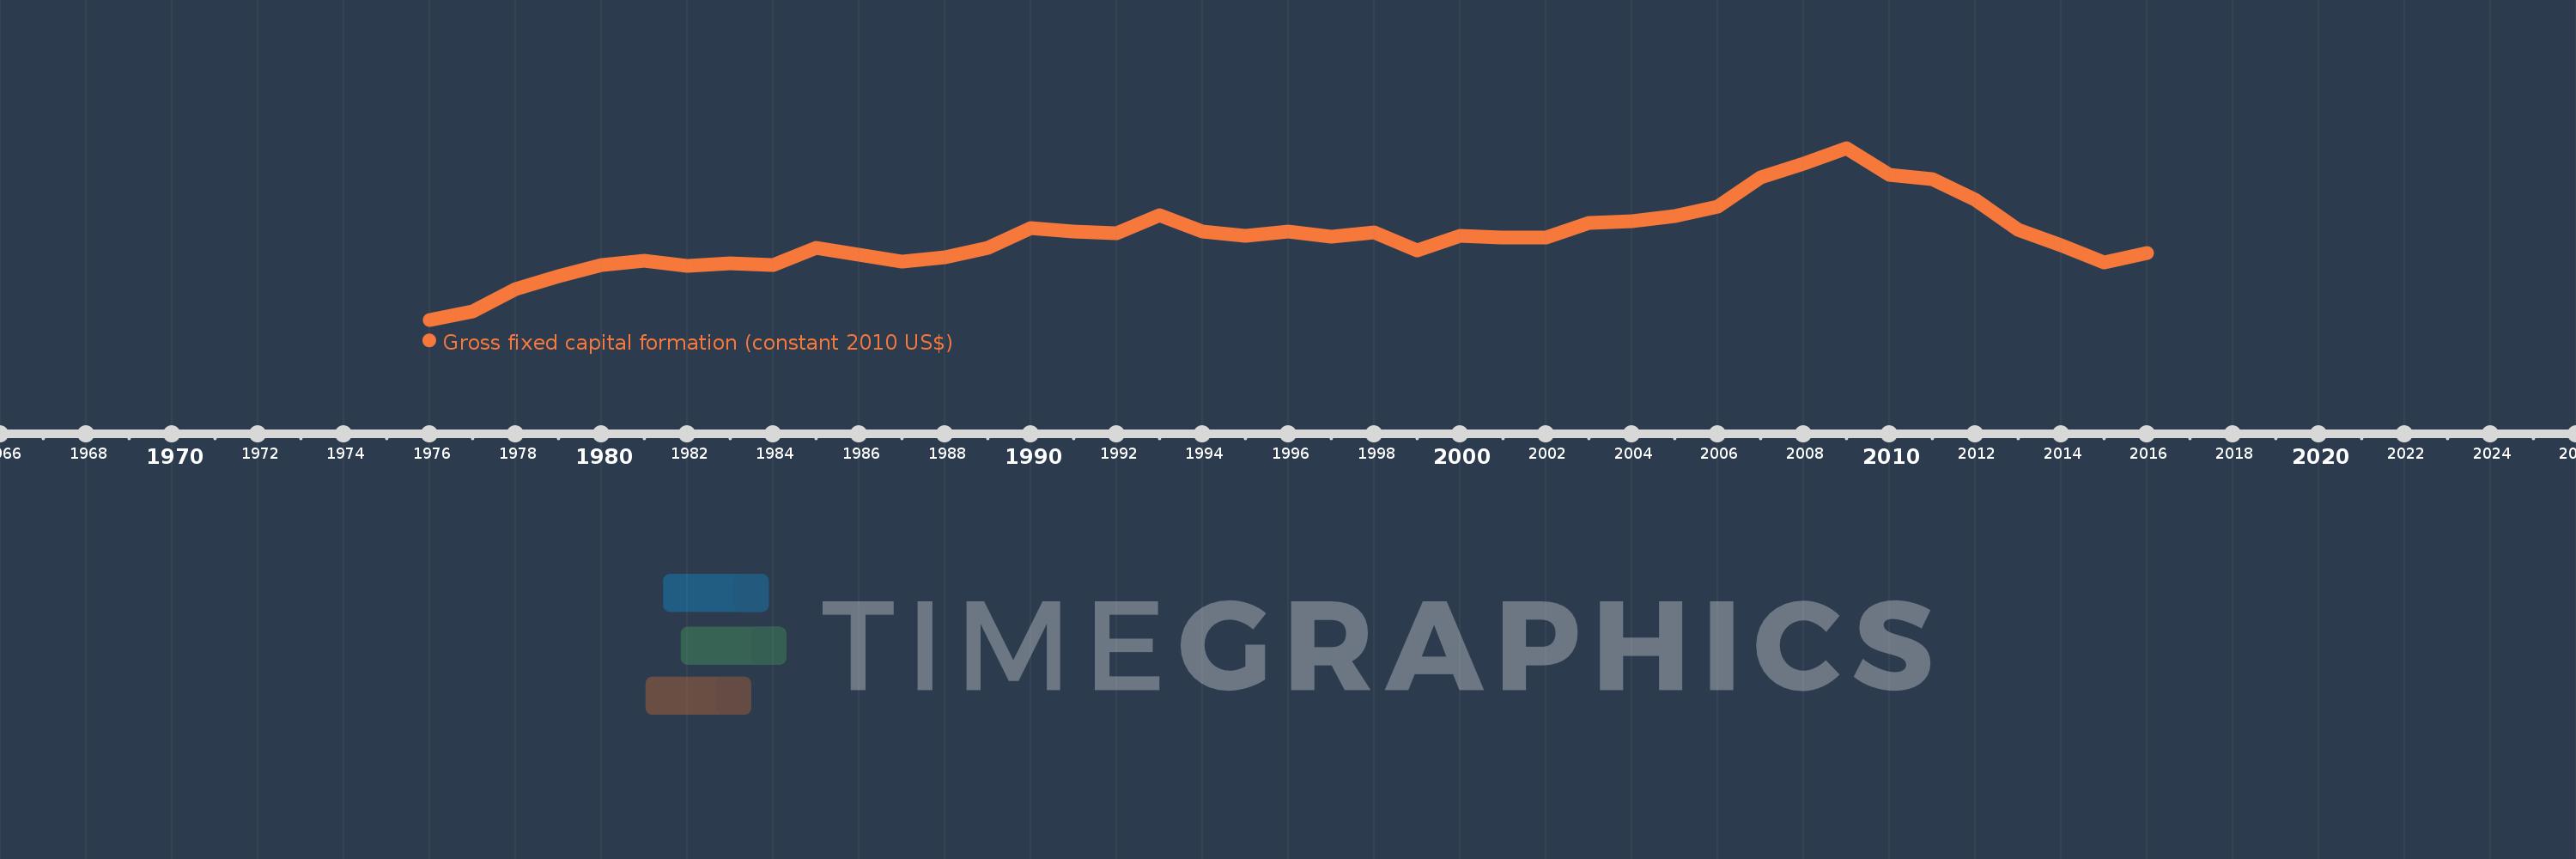
Gross fixed capital formation (constant 2010 US$)
2016,2015,2014,2013,2012,2011,2010,2009,2008,2007,2006,2005,2004,2003,2002,2001,2000,1999,1998,1997,1996,1995,1994,1993,1992,1991,1990,1989,1988,1987,1986,1985,1984,1983,1982,1981,1980,1979,1978,1977,1976
This statistics in other country:
AfghanistanAlbaniaAlgeriaAngolaAntigua and BarbudaArab WorldArgentinaArmeniaAustraliaAustriaAzerbaijanBahamas, TheBahrainBangladeshBarbadosBelarusBelgiumBelizeBeninBermudaBhutanBoliviaBosnia and HerzegovinaBotswanaBrazilBrunei DarussalamBulgariaBurkina FasoBurundiCabo VerdeCambodiaCameroonCanadaCaribbean small statesCentral African RepublicCentral Europe and the BalticsChadChileChinaColombiaComorosCongo, Dem. Rep.Congo, Rep.Costa RicaCote d'IvoireCroatiaCubaCyprusCzech RepublicDenmarkDominicaDominican RepublicEarly-demographic dividendEast Asia & PacificEast Asia & Pacific (excluding high income)East Asia & Pacific (IDA & IBRD countries)EcuadorEgypt, Arab Rep.El SalvadorEquatorial GuineaEritreaEstoniaEuro areaEurope & Central AsiaEurope & Central Asia (excluding high income)Europe & Central Asia (IDA & IBRD countries)European UnionFinlandFragile and conflict affected situationsFranceGabonGambia, TheGeorgiaGermanyGhanaGreeceGrenadaGuatemalaGuineaGuinea-BissauGuyanaHaitiHeavily indebted poor countries (HIPC)High incomeHondurasHong Kong SAR, ChinaHungaryIBRD onlyIcelandIDA & IBRD totalIDA blendIDA onlyIDA totalIndiaIndonesiaIran, Islamic Rep.IraqIrelandIsraelItalyJamaicaJapanJordanKazakhstanKenyaKorea, Rep.KosovoKyrgyz RepublicLao PDRLate-demographic dividendLatin America & Caribbean Latin America & Caribbean (excluding high income)Latin America & the Caribbean (IDA & IBRD countries)LatviaLeast developed countries: UN classificationLebanonLiberiaLithuaniaLow & middle incomeLow incomeLower middle incomeLuxembourgMacao SAR, ChinaMacedonia, FYRMadagascarMalawiMalaysiaMaliMaltaMauritaniaMauritiusMexicoMiddle East & North AfricaMiddle East & North Africa (excluding high income)Middle East & North Africa (IDA & IBRD countries)Middle incomeMoldovaMongoliaMontenegroMoroccoMozambiqueNamibiaNepalNetherlandsNew ZealandNicaraguaNigerNigeriaNorth AmericaNorwayOECD membersOmanPakistanPanamaParaguayPeruPhilippinesPolandPortugalPost-demographic dividendPre-demographic dividendPuerto RicoRomaniaRussian FederationRwandaSaudi ArabiaSenegalSerbiaSeychellesSierra LeoneSingaporeSlovak RepublicSloveniaSouth AfricaSouth AsiaSouth Asia (IDA & IBRD)South SudanSpainSri LankaSt. Kitts and NevisSt. LuciaSt. Vincent and the GrenadinesSub-Saharan Africa Sub-Saharan Africa (excluding high income)Sub-Saharan Africa (IDA & IBRD countries)SudanSurinameSwazilandSwedenSwitzerlandTajikistanTanzaniaThailandTimor-LesteTogoTongaTrinidad and TobagoTunisiaTurkeyTurkmenistanUgandaUkraineUnited Arab EmiratesUnited KingdomUnited StatesUpper middle incomeUruguayUzbekistanVanuatuVenezuela, RBVietnamWest Bank and GazaWorldYemen, Rep.ZambiaZimbabwe Timeline:
This timeline shows a graph from 1976 to 2016 of Cyprus. No data until 1975. Number of actual observations by date: 41.
Source name:
World Development Indicators
Source organization:
World Bank national accounts data, and OECD National Accounts data files.
Categories, topics:
Economy & Growth
Last updated:
apr 23, 2017
Indicators value changes by year
Minimum:
914.155 mln
jan 1, 1976
Maximum:
6.764 bln
jan 1, 2009
At the date of observation
Value
Absolute change
Change from previous value
jan 1, 1976
914.155 mln
+914.155 mln
0.0%
jan 1, 1977
1.198 bln
+283.597 mln
31.02%
jan 1, 1978
1.968 bln
+770.425 mln
64.32%
jan 1, 1979
2.389 bln
+420.373 mln
21.36%
jan 1, 1980
2.779 bln
+390.235 mln
16.34%
jan 1, 1981
2.924 bln
+145.276 mln
5.23%
jan 1, 1982
2.736 bln
-188.549 mln
-6.45%
jan 1, 1983
2.838 bln
+102.775 mln
3.76%
jan 1, 1984
2.776 bln
-61.819 mln
-2.18%
jan 1, 1985
3.375 bln
+598.876 mln
21.57%
jan 1, 1986
3.114 bln
-261.187 mln
-7.74%
jan 1, 1987
2.894 bln
-220.232 mln
-7.07%
jan 1, 1988
3.038 bln
+143.73 mln
4.97%
jan 1, 1989
3.36 bln
+322.234 mln
10.61%
jan 1, 1990
4.033 bln
+673.059 mln
20.03%
jan 1, 1991
3.921 bln
-112.048 mln
-2.78%
jan 1, 1992
3.858 bln
-62.592 mln
-1.6%
jan 1, 1993
4.483 bln
+624.376 mln
16.18%
jan 1, 1994
3.932 bln
-550.193 mln
-12.27%
jan 1, 1995
3.776 bln
-156.867 mln
-3.99%
jan 1, 1996
3.919 bln
+143.764 mln
3.81%
jan 1, 1997
3.753 bln
-166.71 mln
-4.25%
jan 1, 1998
3.893 bln
+140.814 mln
3.75%
jan 1, 1999
3.274 bln
-619.168 mln
-15.9%
jan 1, 2000
3.775 bln
+500.573 mln
15.29%
jan 1, 2001
3.712 bln
-62.535 mln
-1.66%
jan 1, 2002
3.718 bln
+5.886 mln
0.16%
jan 1, 2003
4.211 bln
+492.48 mln
13.24%
jan 1, 2004
4.256 bln
+44.878 mln
1.07%
jan 1, 2005
4.455 bln
+199.523 mln
4.69%
jan 1, 2006
4.764 bln
+308.554 mln
6.93%
jan 1, 2007
5.764 bln
+999.822 mln
20.99%
jan 1, 2008
6.214 bln
+450.839 mln
7.82%
jan 1, 2009
6.764 bln
+549.571 mln
8.84%
jan 1, 2010
5.844 bln
-919.777 mln
-13.6%
jan 1, 2011
5.69 bln
-154.204 mln
-2.64%
jan 1, 2012
4.999 bln
-690.973 mln
-12.14%
jan 1, 2013
3.975 bln
-1.024 bln
-20.49%
jan 1, 2014
3.463 bln
-511.756 mln
-12.88%
jan 1, 2015
2.855 bln
-607.397 mln
-17.54%
jan 1, 2016
3.197 bln
+341.955 mln
11.98%
Ranking of countries by current statistics by years


Comments: