29
/
en
AIzaSyAYiBZKx7MnpbEhh9jyipgxe19OcubqV5w
April 1, 2024
40750
Late-demographic dividend
LTE
false
2
1
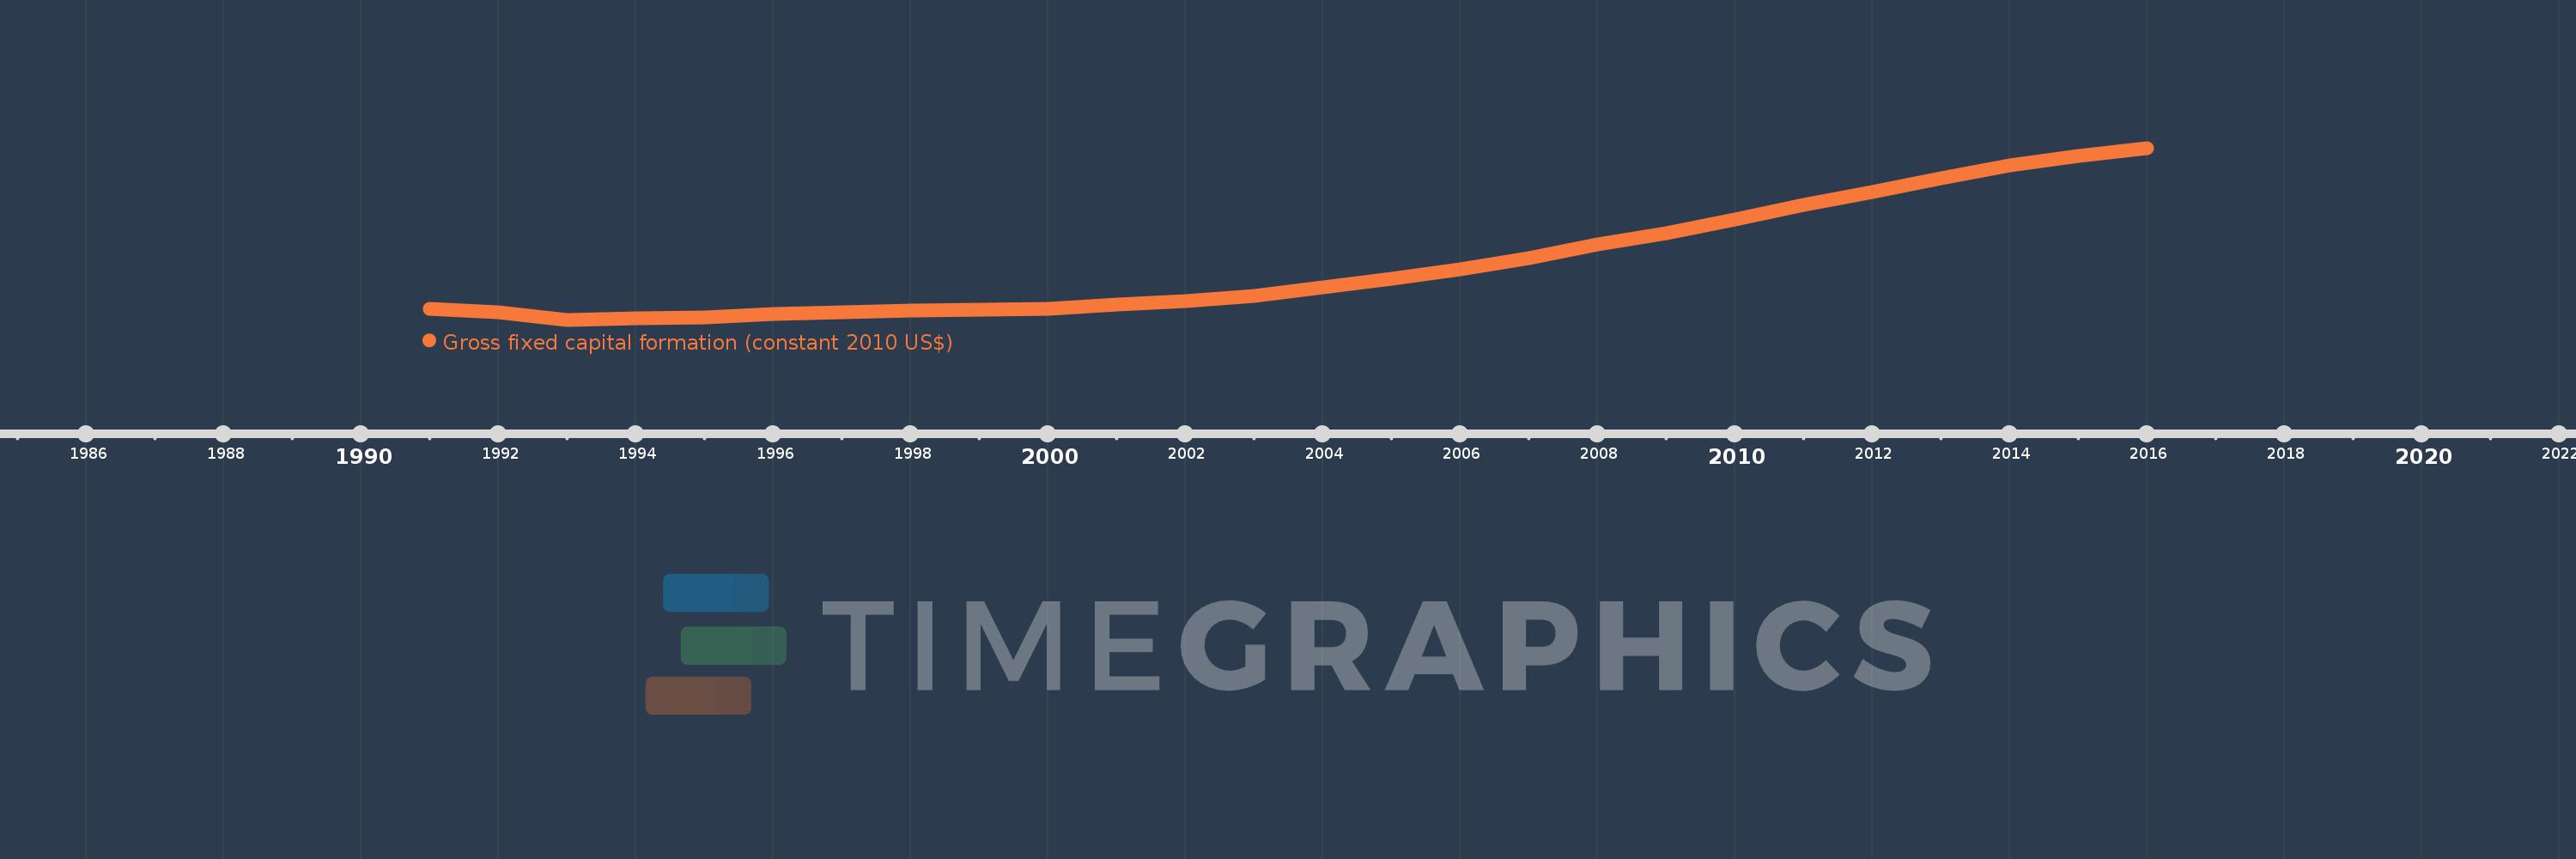
Gross fixed capital formation (constant 2010 US$)
2016,2015,2014,2013,2012,2011,2010,2009,2008,2007,2006,2005,2004,2003,2002,2001,2000,1999,1998,1997,1996,1995,1994,1993,1992,1991
This statistics in other country:
AfghanistanAlbaniaAlgeriaAngolaAntigua and BarbudaArab WorldArgentinaArmeniaAustraliaAustriaAzerbaijanBahamas, TheBahrainBangladeshBarbadosBelarusBelgiumBelizeBeninBermudaBhutanBoliviaBosnia and HerzegovinaBotswanaBrazilBrunei DarussalamBulgariaBurkina FasoBurundiCabo VerdeCambodiaCameroonCanadaCaribbean small statesCentral African RepublicCentral Europe and the BalticsChadChileChinaColombiaComorosCongo, Dem. Rep.Congo, Rep.Costa RicaCote d'IvoireCroatiaCubaCyprusCzech RepublicDenmarkDominicaDominican RepublicEarly-demographic dividendEast Asia & PacificEast Asia & Pacific (excluding high income)East Asia & Pacific (IDA & IBRD countries)EcuadorEgypt, Arab Rep.El SalvadorEquatorial GuineaEritreaEstoniaEuro areaEurope & Central AsiaEurope & Central Asia (excluding high income)Europe & Central Asia (IDA & IBRD countries)European UnionFinlandFragile and conflict affected situationsFranceGabonGambia, TheGeorgiaGermanyGhanaGreeceGrenadaGuatemalaGuineaGuinea-BissauGuyanaHaitiHeavily indebted poor countries (HIPC)High incomeHondurasHong Kong SAR, ChinaHungaryIBRD onlyIcelandIDA & IBRD totalIDA blendIDA onlyIDA totalIndiaIndonesiaIran, Islamic Rep.IraqIrelandIsraelItalyJamaicaJapanJordanKazakhstanKenyaKorea, Rep.KosovoKyrgyz RepublicLao PDRLate-demographic dividendLatin America & Caribbean Latin America & Caribbean (excluding high income)Latin America & the Caribbean (IDA & IBRD countries)LatviaLeast developed countries: UN classificationLebanonLiberiaLithuaniaLow & middle incomeLow incomeLower middle incomeLuxembourgMacao SAR, ChinaMacedonia, FYRMadagascarMalawiMalaysiaMaliMaltaMauritaniaMauritiusMexicoMiddle East & North AfricaMiddle East & North Africa (excluding high income)Middle East & North Africa (IDA & IBRD countries)Middle incomeMoldovaMongoliaMontenegroMoroccoMozambiqueNamibiaNepalNetherlandsNew ZealandNicaraguaNigerNigeriaNorth AmericaNorwayOECD membersOmanPakistanPanamaParaguayPeruPhilippinesPolandPortugalPost-demographic dividendPre-demographic dividendPuerto RicoRomaniaRussian FederationRwandaSaudi ArabiaSenegalSerbiaSeychellesSierra LeoneSingaporeSlovak RepublicSloveniaSouth AfricaSouth AsiaSouth Asia (IDA & IBRD)South SudanSpainSri LankaSt. Kitts and NevisSt. LuciaSt. Vincent and the GrenadinesSub-Saharan Africa Sub-Saharan Africa (excluding high income)Sub-Saharan Africa (IDA & IBRD countries)SudanSurinameSwazilandSwedenSwitzerlandTajikistanTanzaniaThailandTimor-LesteTogoTongaTrinidad and TobagoTunisiaTurkeyTurkmenistanUgandaUkraineUnited Arab EmiratesUnited KingdomUnited StatesUpper middle incomeUruguayUzbekistanVanuatuVenezuela, RBVietnamWest Bank and GazaWorldYemen, Rep.ZambiaZimbabwe Timeline:
This timeline shows a graph from 1991 to 2016 of Late-demographic dividend. No data until 1990. Number of actual observations by date: 26.
Source name:
World Development Indicators
Source organization:
World Bank national accounts data, and OECD National Accounts data files.
Categories, topics:
Economy & Growth
Last updated:
apr 23, 2017
Indicators value changes by year
Minimum:
1.184 trl
jan 1, 1993
Maximum:
5.968 trl
jan 1, 2016
At the date of observation
Value
Absolute change
Change from previous value
jan 1, 1991
1.481 trl
+1.481 trl
0.0%
jan 1, 1992
1.398 trl
-83.155 bln
-5.62%
jan 1, 1993
1.184 trl
-213.252 bln
-15.26%
jan 1, 1994
1.217 trl
+32.744 bln
2.76%
jan 1, 1995
1.252 trl
+35.402 bln
2.91%
jan 1, 1996
1.334 trl
+81.81 bln
6.53%
jan 1, 1997
1.386 trl
+52.002 bln
3.9%
jan 1, 1998
1.443 trl
+56.911 bln
4.11%
jan 1, 1999
1.463 trl
+20.009 bln
1.39%
jan 1, 2000
1.482 trl
+18.989 bln
1.3%
jan 1, 2001
1.601 trl
+118.407 bln
7.99%
jan 1, 2002
1.715 trl
+114.481 bln
7.15%
jan 1, 2003
1.846 trl
+131.358 bln
7.66%
jan 1, 2004
2.075 trl
+228.334 bln
12.37%
jan 1, 2005
2.321 trl
+246.574 bln
11.88%
jan 1, 2006
2.585 trl
+263.453 bln
11.35%
jan 1, 2007
2.897 trl
+311.925 bln
12.07%
jan 1, 2008
3.283 trl
+385.998 bln
13.33%
jan 1, 2009
3.605 trl
+322.143 bln
9.81%
jan 1, 2010
3.968 trl
+362.755 bln
10.06%
jan 1, 2011
4.388 trl
+420.721 bln
10.6%
jan 1, 2012
4.753 trl
+364.447 bln
8.3%
jan 1, 2013
5.12 trl
+367.246 bln
7.73%
jan 1, 2014
5.487 trl
+366.599 bln
7.16%
jan 1, 2015
5.743 trl
+256.494 bln
4.67%
jan 1, 2016
5.968 trl
+225.267 bln
3.92%
Ranking of countries by current statistics by years


Comments: