29
/
en
AIzaSyAYiBZKx7MnpbEhh9jyipgxe19OcubqV5w
April 1, 2024
187850
Malaysia
MYS
true
2
1
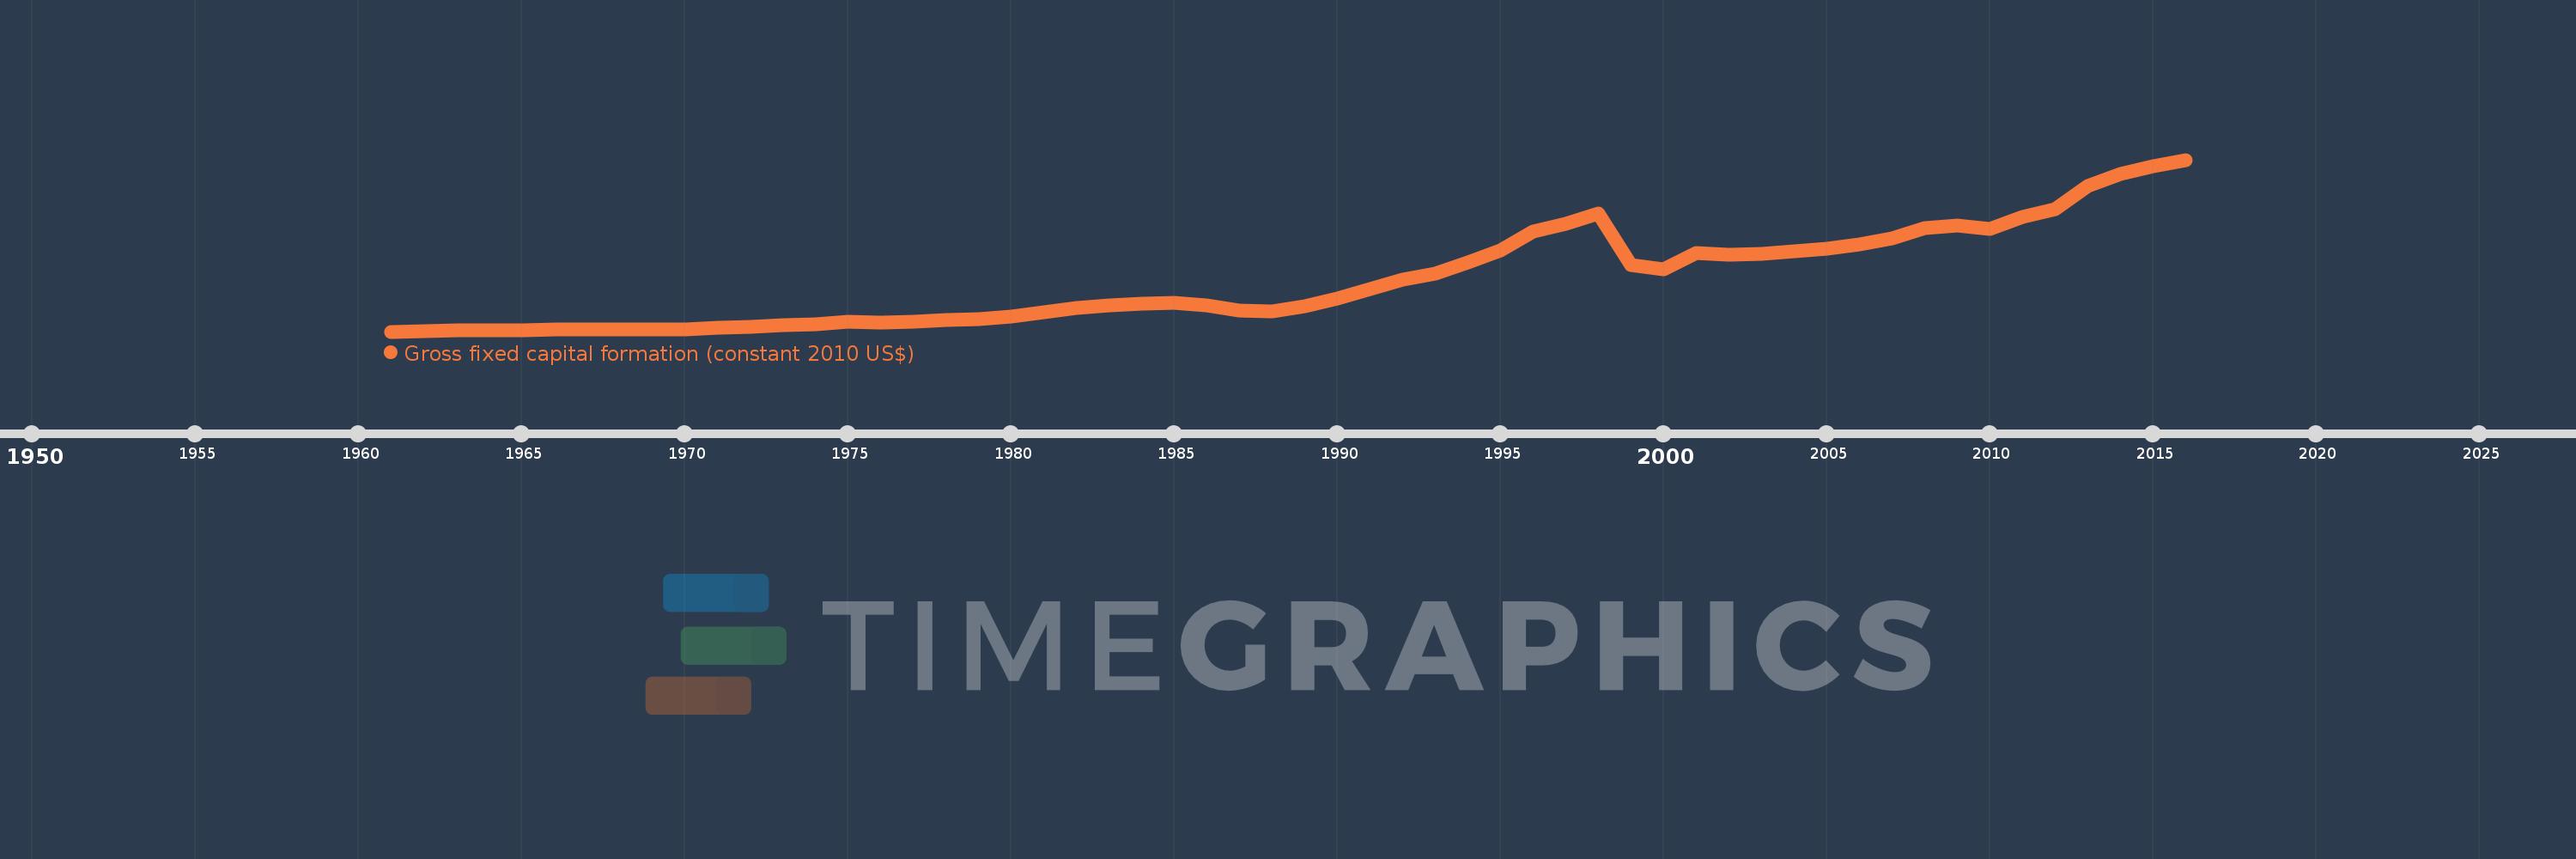
Gross fixed capital formation (constant 2010 US$)
2016,2015,2014,2013,2012,2011,2010,2009,2008,2007,2006,2005,2004,2003,2002,2001,2000,1999,1998,1997,1996,1995,1994,1993,1992,1991,1990,1989,1988,1987,1986,1985,1984,1983,1982,1981,1980,1979,1978,1977,1976,1975,1974,1973,1972,1971,1970,1969,1968,1967,1966,1965,1964,1963,1962,1961
This statistics in other country:
AfghanistanAlbaniaAlgeriaAngolaAntigua and BarbudaArab WorldArgentinaArmeniaAustraliaAustriaAzerbaijanBahamas, TheBahrainBangladeshBarbadosBelarusBelgiumBelizeBeninBermudaBhutanBoliviaBosnia and HerzegovinaBotswanaBrazilBrunei DarussalamBulgariaBurkina FasoBurundiCabo VerdeCambodiaCameroonCanadaCaribbean small statesCentral African RepublicCentral Europe and the BalticsChadChileChinaColombiaComorosCongo, Dem. Rep.Congo, Rep.Costa RicaCote d'IvoireCroatiaCubaCyprusCzech RepublicDenmarkDominicaDominican RepublicEarly-demographic dividendEast Asia & PacificEast Asia & Pacific (excluding high income)East Asia & Pacific (IDA & IBRD countries)EcuadorEgypt, Arab Rep.El SalvadorEquatorial GuineaEritreaEstoniaEuro areaEurope & Central AsiaEurope & Central Asia (excluding high income)Europe & Central Asia (IDA & IBRD countries)European UnionFinlandFragile and conflict affected situationsFranceGabonGambia, TheGeorgiaGermanyGhanaGreeceGrenadaGuatemalaGuineaGuinea-BissauGuyanaHaitiHeavily indebted poor countries (HIPC)High incomeHondurasHong Kong SAR, ChinaHungaryIBRD onlyIcelandIDA & IBRD totalIDA blendIDA onlyIDA totalIndiaIndonesiaIran, Islamic Rep.IraqIrelandIsraelItalyJamaicaJapanJordanKazakhstanKenyaKorea, Rep.KosovoKyrgyz RepublicLao PDRLate-demographic dividendLatin America & Caribbean Latin America & Caribbean (excluding high income)Latin America & the Caribbean (IDA & IBRD countries)LatviaLeast developed countries: UN classificationLebanonLiberiaLithuaniaLow & middle incomeLow incomeLower middle incomeLuxembourgMacao SAR, ChinaMacedonia, FYRMadagascarMalawiMalaysiaMaliMaltaMauritaniaMauritiusMexicoMiddle East & North AfricaMiddle East & North Africa (excluding high income)Middle East & North Africa (IDA & IBRD countries)Middle incomeMoldovaMongoliaMontenegroMoroccoMozambiqueNamibiaNepalNetherlandsNew ZealandNicaraguaNigerNigeriaNorth AmericaNorwayOECD membersOmanPakistanPanamaParaguayPeruPhilippinesPolandPortugalPost-demographic dividendPre-demographic dividendPuerto RicoRomaniaRussian FederationRwandaSaudi ArabiaSenegalSerbiaSeychellesSierra LeoneSingaporeSlovak RepublicSloveniaSouth AfricaSouth AsiaSouth Asia (IDA & IBRD)South SudanSpainSri LankaSt. Kitts and NevisSt. LuciaSt. Vincent and the GrenadinesSub-Saharan Africa Sub-Saharan Africa (excluding high income)Sub-Saharan Africa (IDA & IBRD countries)SudanSurinameSwazilandSwedenSwitzerlandTajikistanTanzaniaThailandTimor-LesteTogoTongaTrinidad and TobagoTunisiaTurkeyTurkmenistanUgandaUkraineUnited Arab EmiratesUnited KingdomUnited StatesUpper middle incomeUruguayUzbekistanVanuatuVenezuela, RBVietnamWest Bank and GazaWorldYemen, Rep.ZambiaZimbabwe Timeline:
This timeline shows a graph from 1961 to 2016 of Malaysia. No data until 1960. Number of actual observations by date: 56.
Source name:
World Development Indicators
Source organization:
World Bank national accounts data, and OECD National Accounts data files.
Categories, topics:
Economy & Growth
Last updated:
apr 23, 2017
Indicators value changes by year
Minimum:
1.268 bln
jan 1, 1961
Maximum:
85.067 bln
jan 1, 2016
At the date of observation
Value
Absolute change
Change from previous value
jan 1, 1961
1.268 bln
+1.268 bln
0.0%
jan 1, 1962
1.532 bln
+263.753 mln
20.8%
jan 1, 1963
1.752 bln
+220.707 mln
14.41%
jan 1, 1964
1.886 bln
+133.833 mln
7.64%
jan 1, 1965
1.922 bln
+36.002 mln
1.91%
jan 1, 1966
2.133 bln
+210.532 mln
10.95%
jan 1, 1967
2.329 bln
+196.445 mln
9.21%
jan 1, 1968
2.382 bln
+53.22 mln
2.28%
jan 1, 1969
2.44 bln
+57.133 mln
2.4%
jan 1, 1970
2.458 bln
+18.784 mln
0.77%
jan 1, 1971
3.149 bln
+691.078 mln
28.11%
jan 1, 1972
3.742 bln
+592.465 mln
18.81%
jan 1, 1973
4.296 bln
+554.115 mln
14.81%
jan 1, 1974
5.004 bln
+708.297 mln
16.49%
jan 1, 1975
6.098 bln
+1.094 bln
21.86%
jan 1, 1976
5.645 bln
-453.153 mln
-7.43%
jan 1, 1977
5.928 bln
+282.536 mln
5.0%
jan 1, 1978
6.793 bln
+864.826 mln
14.59%
jan 1, 1979
7.342 bln
+549.419 mln
8.09%
jan 1, 1980
8.742 bln
+1.4 bln
19.07%
jan 1, 1981
10.903 bln
+2.161 bln
24.72%
jan 1, 1982
12.875 bln
+1.971 bln
18.08%
jan 1, 1983
13.905 bln
+1.031 bln
8.01%
jan 1, 1984
15.021 bln
+1.116 bln
8.03%
jan 1, 1985
15.466 bln
+444.545 mln
2.96%
jan 1, 1986
14.0 bln
-1.466 bln
-9.48%
jan 1, 1987
11.427 bln
-2.573 bln
-18.38%
jan 1, 1988
10.921 bln
-506.372 mln
-4.43%
jan 1, 1989
13.456 bln
+2.534 bln
23.21%
jan 1, 1990
17.226 bln
+3.77 bln
28.02%
jan 1, 1991
21.89 bln
+4.664 bln
27.08%
jan 1, 1992
26.785 bln
+4.896 bln
22.37%
jan 1, 1993
29.729 bln
+2.944 bln
10.99%
jan 1, 1994
35.021 bln
+5.292 bln
17.8%
jan 1, 1995
40.666 bln
+5.645 bln
16.12%
jan 1, 1996
49.954 bln
+9.288 bln
22.84%
jan 1, 1997
54.059 bln
+4.105 bln
8.22%
jan 1, 1998
59.012 bln
+4.953 bln
9.16%
jan 1, 1999
33.657 bln
-25.355 bln
-42.97%
jan 1, 2000
31.455 bln
-2.201 bln
-6.54%
jan 1, 2001
39.766 bln
+8.31 bln
26.42%
jan 1, 2002
38.946 bln
-820.1 mln
-2.06%
jan 1, 2003
39.171 bln
+224.987 mln
0.58%
jan 1, 2004
40.285 bln
+1.114 bln
2.84%
jan 1, 2005
41.716 bln
+1.432 bln
3.55%
jan 1, 2006
43.792 bln
+2.076 bln
4.98%
jan 1, 2007
46.535 bln
+2.743 bln
6.26%
jan 1, 2008
51.558 bln
+5.023 bln
10.79%
jan 1, 2009
52.841 bln
+1.284 bln
2.49%
jan 1, 2010
51.527 bln
-1.314 bln
-2.49%
jan 1, 2011
57.214 bln
+5.687 bln
11.04%
jan 1, 2012
60.847 bln
+3.634 bln
6.35%
jan 1, 2013
72.398 bln
+11.551 bln
18.98%
jan 1, 2014
78.284 bln
+5.886 bln
8.13%
jan 1, 2015
82.033 bln
+3.748 bln
4.79%
jan 1, 2016
85.067 bln
+3.035 bln
3.7%
Ranking of countries by current statistics by years


Comments: