29
/
en
AIzaSyAYiBZKx7MnpbEhh9jyipgxe19OcubqV5w
April 1, 2024
166207
Kazakhstan
KAZ
true
2
1
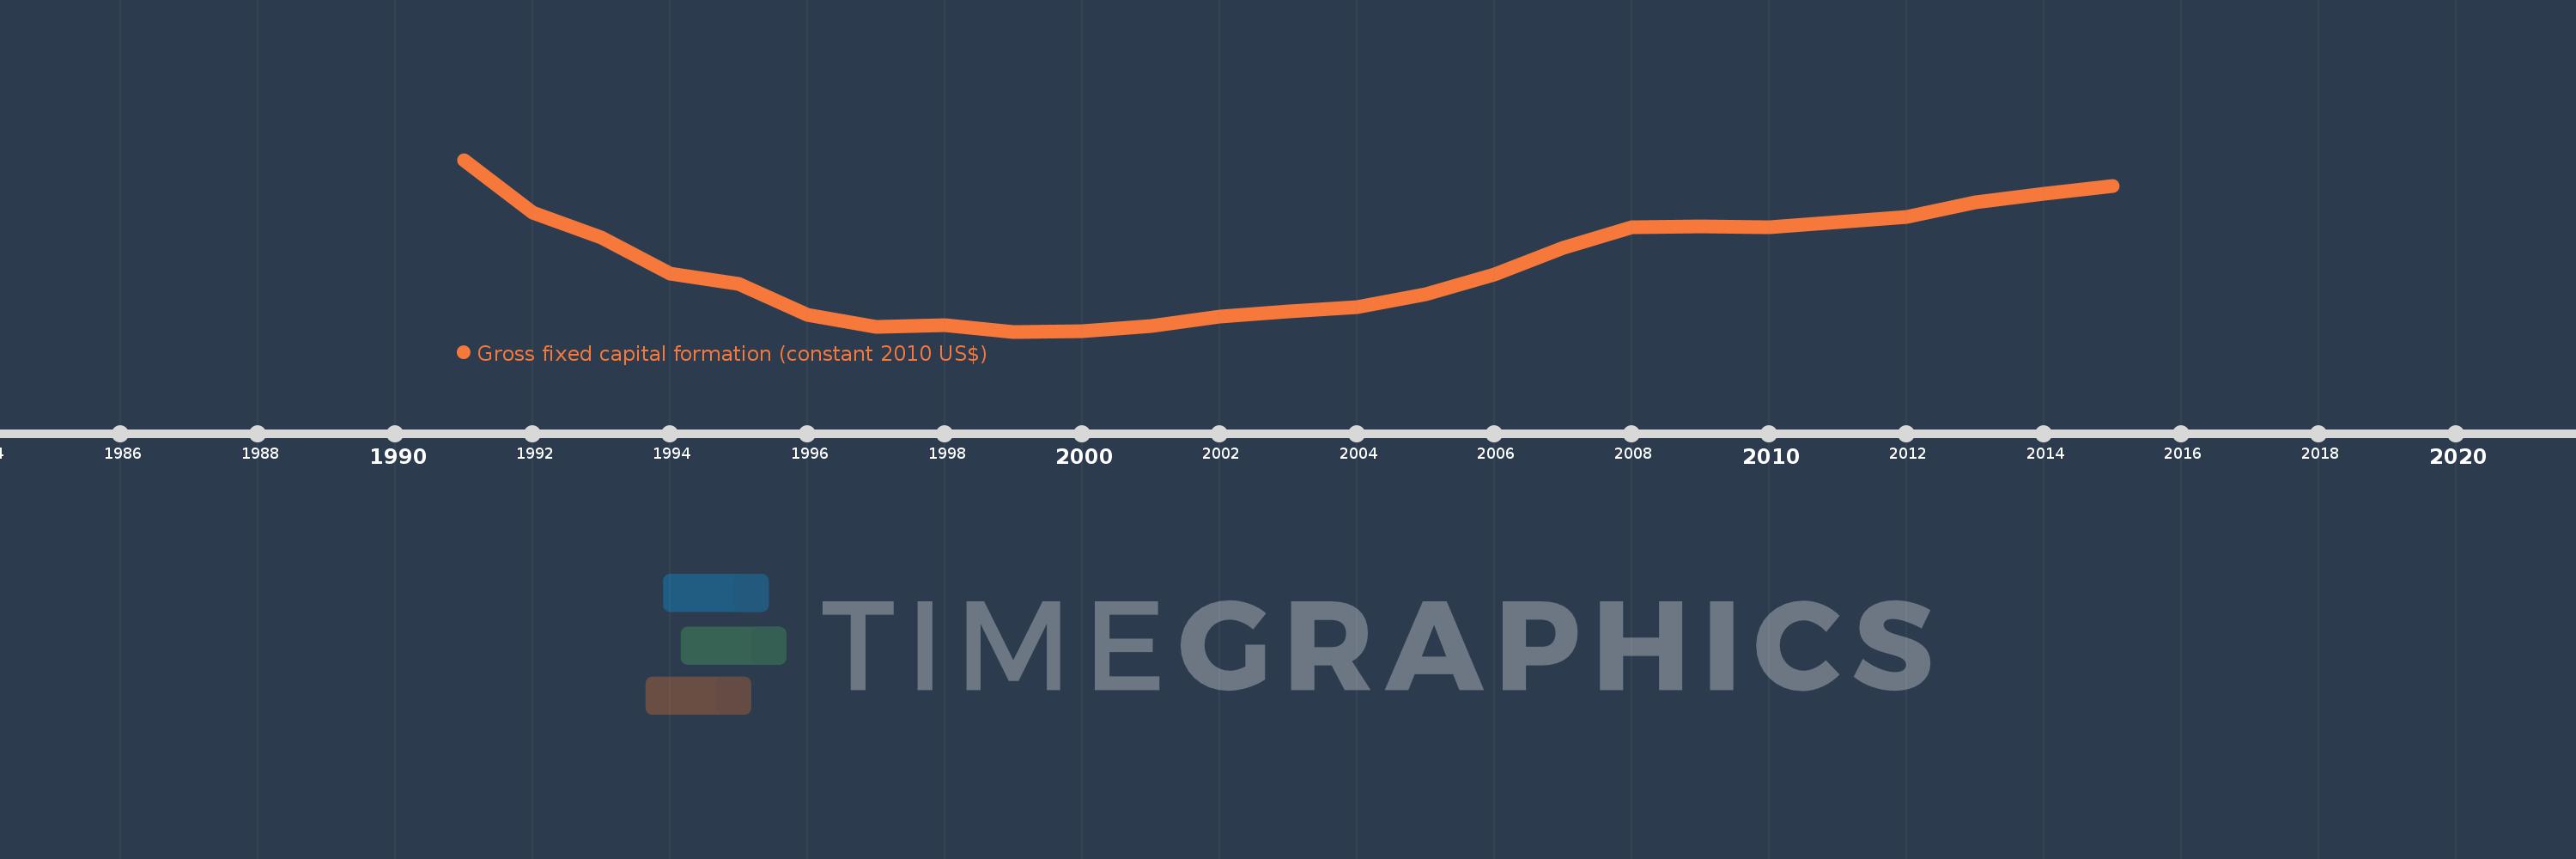
Gross fixed capital formation (constant 2010 US$)
2015,2014,2013,2012,2011,2010,2009,2008,2007,2006,2005,2004,2003,2002,2001,2000,1999,1998,1997,1996,1995,1994,1993,1992,1991
This statistics in other country:
AfghanistanAlbaniaAlgeriaAngolaAntigua and BarbudaArab WorldArgentinaArmeniaAustraliaAustriaAzerbaijanBahamas, TheBahrainBangladeshBarbadosBelarusBelgiumBelizeBeninBermudaBhutanBoliviaBosnia and HerzegovinaBotswanaBrazilBrunei DarussalamBulgariaBurkina FasoBurundiCabo VerdeCambodiaCameroonCanadaCaribbean small statesCentral African RepublicCentral Europe and the BalticsChadChileChinaColombiaComorosCongo, Dem. Rep.Congo, Rep.Costa RicaCote d'IvoireCroatiaCubaCyprusCzech RepublicDenmarkDominicaDominican RepublicEarly-demographic dividendEast Asia & PacificEast Asia & Pacific (excluding high income)East Asia & Pacific (IDA & IBRD countries)EcuadorEgypt, Arab Rep.El SalvadorEquatorial GuineaEritreaEstoniaEuro areaEurope & Central AsiaEurope & Central Asia (excluding high income)Europe & Central Asia (IDA & IBRD countries)European UnionFinlandFragile and conflict affected situationsFranceGabonGambia, TheGeorgiaGermanyGhanaGreeceGrenadaGuatemalaGuineaGuinea-BissauGuyanaHaitiHeavily indebted poor countries (HIPC)High incomeHondurasHong Kong SAR, ChinaHungaryIBRD onlyIcelandIDA & IBRD totalIDA blendIDA onlyIDA totalIndiaIndonesiaIran, Islamic Rep.IraqIrelandIsraelItalyJamaicaJapanJordanKazakhstanKenyaKorea, Rep.KosovoKyrgyz RepublicLao PDRLate-demographic dividendLatin America & Caribbean Latin America & Caribbean (excluding high income)Latin America & the Caribbean (IDA & IBRD countries)LatviaLeast developed countries: UN classificationLebanonLiberiaLithuaniaLow & middle incomeLow incomeLower middle incomeLuxembourgMacao SAR, ChinaMacedonia, FYRMadagascarMalawiMalaysiaMaliMaltaMauritaniaMauritiusMexicoMiddle East & North AfricaMiddle East & North Africa (excluding high income)Middle East & North Africa (IDA & IBRD countries)Middle incomeMoldovaMongoliaMontenegroMoroccoMozambiqueNamibiaNepalNetherlandsNew ZealandNicaraguaNigerNigeriaNorth AmericaNorwayOECD membersOmanPakistanPanamaParaguayPeruPhilippinesPolandPortugalPost-demographic dividendPre-demographic dividendPuerto RicoRomaniaRussian FederationRwandaSaudi ArabiaSenegalSerbiaSeychellesSierra LeoneSingaporeSlovak RepublicSloveniaSouth AfricaSouth AsiaSouth Asia (IDA & IBRD)South SudanSpainSri LankaSt. Kitts and NevisSt. LuciaSt. Vincent and the GrenadinesSub-Saharan Africa Sub-Saharan Africa (excluding high income)Sub-Saharan Africa (IDA & IBRD countries)SudanSurinameSwazilandSwedenSwitzerlandTajikistanTanzaniaThailandTimor-LesteTogoTongaTrinidad and TobagoTunisiaTurkeyTurkmenistanUgandaUkraineUnited Arab EmiratesUnited KingdomUnited StatesUpper middle incomeUruguayUzbekistanVanuatuVenezuela, RBVietnamWest Bank and GazaWorldYemen, Rep.ZambiaZimbabwe Timeline:
This timeline shows a graph from 1991 to 2015 of Kazakhstan. No data until 1990. Number of actual observations by date: 25.
Source name:
World Development Indicators
Source organization:
World Bank national accounts data, and OECD National Accounts data files.
Categories, topics:
Economy & Growth
Last updated:
apr 23, 2017
Indicators value changes by year
Minimum:
8.31 bln
jan 1, 1999
Maximum:
51.696 bln
jan 1, 1991
At the date of observation
Value
Absolute change
Change from previous value
jan 1, 1991
51.696 bln
+51.696 bln
0.0%
jan 1, 1992
38.358 bln
-13.338 bln
-25.8%
jan 1, 1993
31.991 bln
-6.367 bln
-16.6%
jan 1, 1994
22.873 bln
-9.117 bln
-28.5%
jan 1, 1995
20.266 bln
-2.608 bln
-11.4%
jan 1, 1996
12.585 bln
-7.681 bln
-37.9%
jan 1, 1997
9.577 bln
-3.008 bln
-23.9%
jan 1, 1998
9.893 bln
+316.049 mln
3.3%
jan 1, 1999
8.31 bln
-1.583 bln
-16.0%
jan 1, 2000
8.393 bln
+83.104 mln
1.0%
jan 1, 2001
9.745 bln
+1.351 bln
16.1%
jan 1, 2002
12.21 bln
+2.465 bln
25.3%
jan 1, 2003
13.431 bln
+1.221 bln
10.0%
jan 1, 2004
14.506 bln
+1.075 bln
8.0%
jan 1, 2005
17.77 bln
+3.264 bln
22.5%
jan 1, 2006
22.763 bln
+4.993 bln
28.1%
jan 1, 2007
29.523 bln
+6.761 bln
29.7%
jan 1, 2008
34.631 bln
+5.108 bln
17.3%
jan 1, 2009
34.977 bln
+346.31 mln
1.0%
jan 1, 2010
34.697 bln
-279.818 mln
-0.8%
jan 1, 2011
36.016 bln
+1.319 bln
3.8%
jan 1, 2012
37.241 bln
+1.225 bln
3.4%
jan 1, 2013
40.927 bln
+3.687 bln
9.9%
jan 1, 2014
43.178 bln
+2.251 bln
5.5%
jan 1, 2015
45.078 bln
+1.9 bln
4.4%
Ranking of countries by current statistics by years


Comments: