29
/
en
AIzaSyAYiBZKx7MnpbEhh9jyipgxe19OcubqV5w
April 1, 2024
190297
Mali
MLI
true
2
1
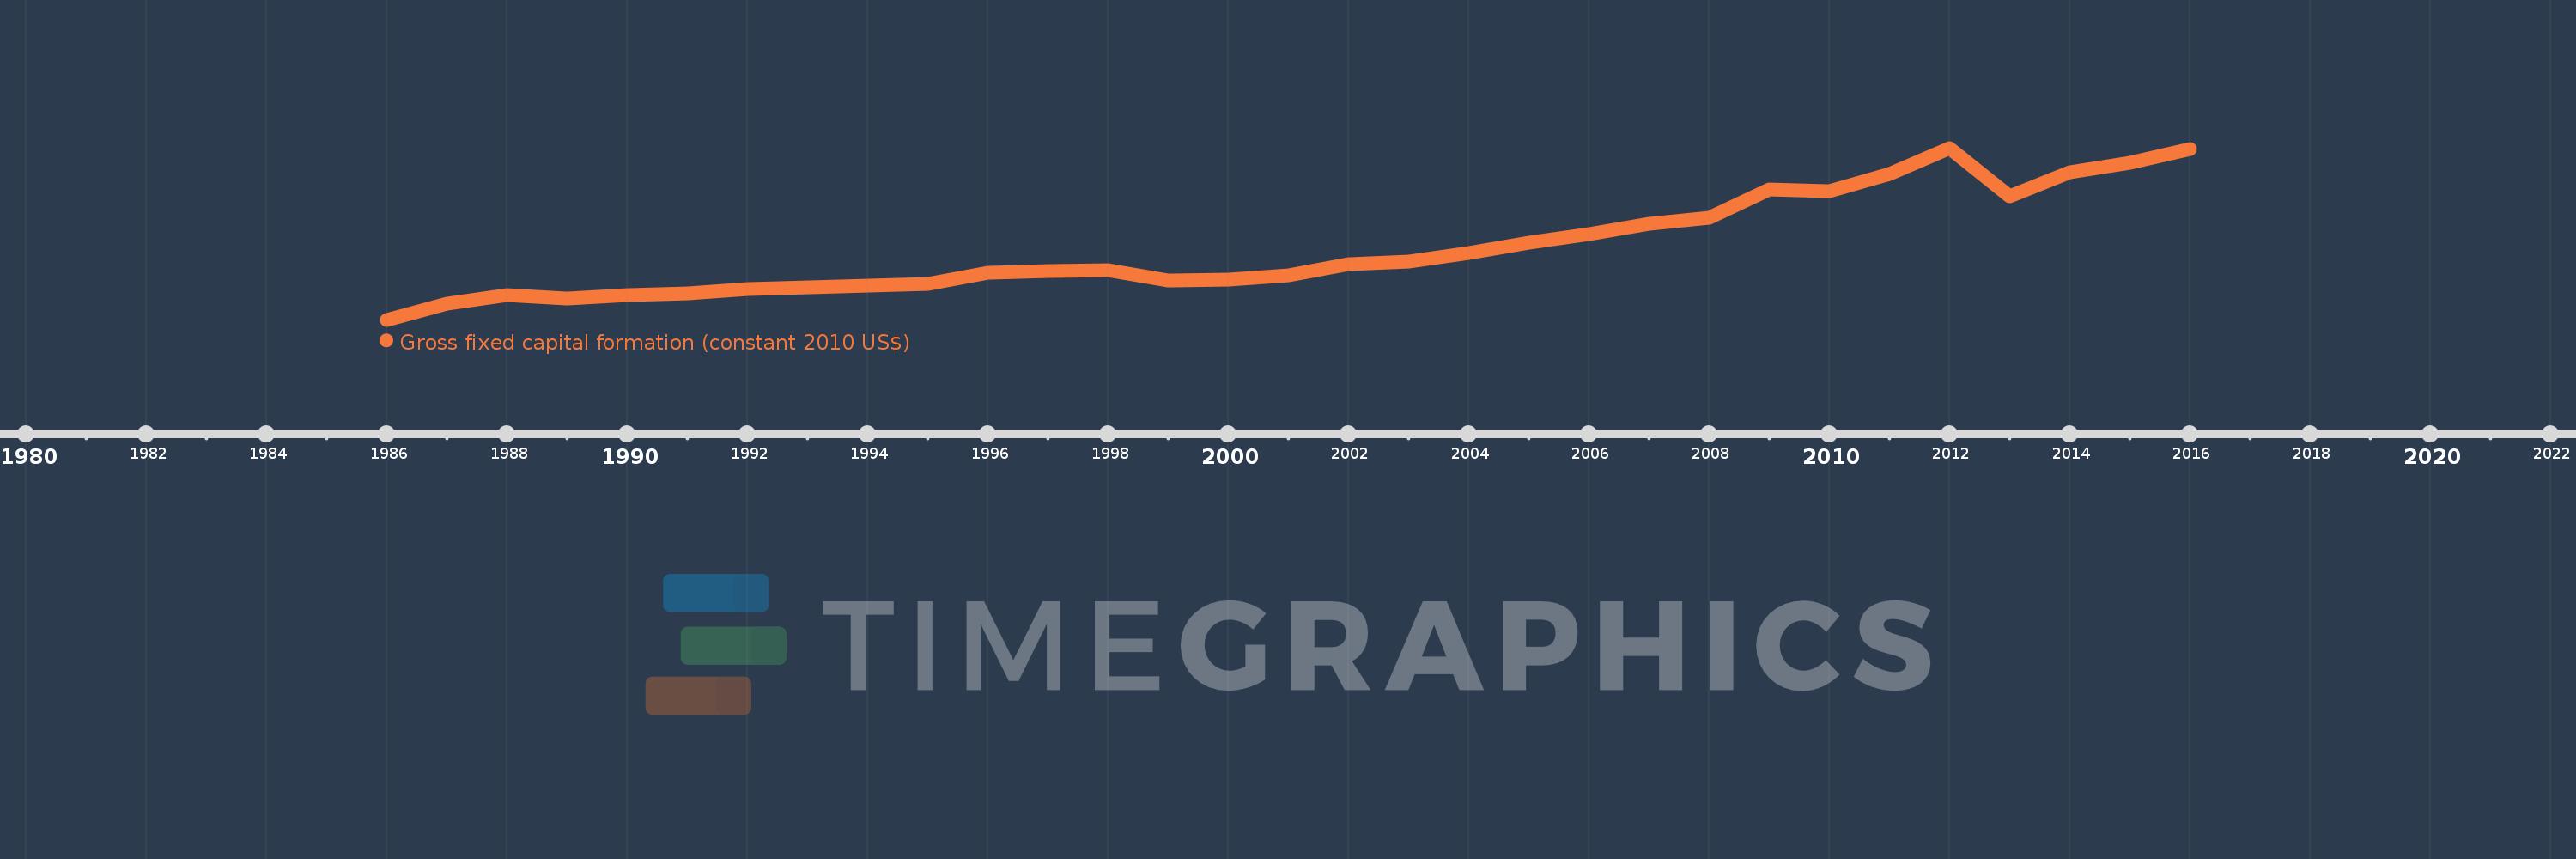
Gross fixed capital formation (constant 2010 US$)
2016,2015,2014,2013,2012,2011,2010,2009,2008,2007,2006,2005,2004,2003,2002,2001,2000,1999,1998,1997,1996,1995,1994,1993,1992,1991,1990,1989,1988,1987,1986
This statistics in other country:
AfghanistanAlbaniaAlgeriaAngolaAntigua and BarbudaArab WorldArgentinaArmeniaAustraliaAustriaAzerbaijanBahamas, TheBahrainBangladeshBarbadosBelarusBelgiumBelizeBeninBermudaBhutanBoliviaBosnia and HerzegovinaBotswanaBrazilBrunei DarussalamBulgariaBurkina FasoBurundiCabo VerdeCambodiaCameroonCanadaCaribbean small statesCentral African RepublicCentral Europe and the BalticsChadChileChinaColombiaComorosCongo, Dem. Rep.Congo, Rep.Costa RicaCote d'IvoireCroatiaCubaCyprusCzech RepublicDenmarkDominicaDominican RepublicEarly-demographic dividendEast Asia & PacificEast Asia & Pacific (excluding high income)East Asia & Pacific (IDA & IBRD countries)EcuadorEgypt, Arab Rep.El SalvadorEquatorial GuineaEritreaEstoniaEuro areaEurope & Central AsiaEurope & Central Asia (excluding high income)Europe & Central Asia (IDA & IBRD countries)European UnionFinlandFragile and conflict affected situationsFranceGabonGambia, TheGeorgiaGermanyGhanaGreeceGrenadaGuatemalaGuineaGuinea-BissauGuyanaHaitiHeavily indebted poor countries (HIPC)High incomeHondurasHong Kong SAR, ChinaHungaryIBRD onlyIcelandIDA & IBRD totalIDA blendIDA onlyIDA totalIndiaIndonesiaIran, Islamic Rep.IraqIrelandIsraelItalyJamaicaJapanJordanKazakhstanKenyaKorea, Rep.KosovoKyrgyz RepublicLao PDRLate-demographic dividendLatin America & Caribbean Latin America & Caribbean (excluding high income)Latin America & the Caribbean (IDA & IBRD countries)LatviaLeast developed countries: UN classificationLebanonLiberiaLithuaniaLow & middle incomeLow incomeLower middle incomeLuxembourgMacao SAR, ChinaMacedonia, FYRMadagascarMalawiMalaysiaMaliMaltaMauritaniaMauritiusMexicoMiddle East & North AfricaMiddle East & North Africa (excluding high income)Middle East & North Africa (IDA & IBRD countries)Middle incomeMoldovaMongoliaMontenegroMoroccoMozambiqueNamibiaNepalNetherlandsNew ZealandNicaraguaNigerNigeriaNorth AmericaNorwayOECD membersOmanPakistanPanamaParaguayPeruPhilippinesPolandPortugalPost-demographic dividendPre-demographic dividendPuerto RicoRomaniaRussian FederationRwandaSaudi ArabiaSenegalSerbiaSeychellesSierra LeoneSingaporeSlovak RepublicSloveniaSouth AfricaSouth AsiaSouth Asia (IDA & IBRD)South SudanSpainSri LankaSt. Kitts and NevisSt. LuciaSt. Vincent and the GrenadinesSub-Saharan Africa Sub-Saharan Africa (excluding high income)Sub-Saharan Africa (IDA & IBRD countries)SudanSurinameSwazilandSwedenSwitzerlandTajikistanTanzaniaThailandTimor-LesteTogoTongaTrinidad and TobagoTunisiaTurkeyTurkmenistanUgandaUkraineUnited Arab EmiratesUnited KingdomUnited StatesUpper middle incomeUruguayUzbekistanVanuatuVenezuela, RBVietnamWest Bank and GazaWorldYemen, Rep.ZambiaZimbabwe Timeline:
This timeline shows a graph from 1986 to 2016 of Mali. No data until 1985. Number of actual observations by date: 31.
Source name:
World Development Indicators
Source organization:
World Bank national accounts data, and OECD National Accounts data files.
Categories, topics:
Economy & Growth
Last updated:
apr 23, 2017
Indicators value changes by year
Minimum:
369.442 mln
jan 1, 1986
Maximum:
2.553 bln
jan 1, 2012
At the date of observation
Value
Absolute change
Change from previous value
jan 1, 1986
369.442 mln
+369.442 mln
0.0%
jan 1, 1987
575.822 mln
+206.379 mln
55.86%
jan 1, 1988
680.514 mln
+104.693 mln
18.18%
jan 1, 1989
640.612 mln
-39.902 mln
-5.86%
jan 1, 1990
686.021 mln
+45.409 mln
7.09%
jan 1, 1991
704.607 mln
+18.586 mln
2.71%
jan 1, 1992
763.307 mln
+58.699 mln
8.33%
jan 1, 1993
779.564 mln
+16.258 mln
2.13%
jan 1, 1994
797.852 mln
+18.288 mln
2.35%
jan 1, 1995
825.249 mln
+27.397 mln
3.43%
jan 1, 1996
961.918 mln
+136.669 mln
16.56%
jan 1, 1997
990.851 mln
+28.933 mln
3.01%
jan 1, 1998
1.004 bln
+12.832 mln
1.3%
jan 1, 1999
866.35 mln
-137.333 mln
-13.68%
jan 1, 2000
881.685 mln
+15.336 mln
1.77%
jan 1, 2001
931.936 mln
+50.25 mln
5.7%
jan 1, 2002
1.076 bln
+144.028 mln
15.45%
jan 1, 2003
1.112 bln
+35.555 mln
3.3%
jan 1, 2004
1.217 bln
+105.681 mln
9.51%
jan 1, 2005
1.344 bln
+126.321 mln
10.38%
jan 1, 2006
1.462 bln
+118.039 mln
8.79%
jan 1, 2007
1.588 bln
+126.464 mln
8.65%
jan 1, 2008
1.666 bln
+78.216 mln
4.93%
jan 1, 2009
2.025 bln
+358.733 mln
21.53%
jan 1, 2010
2.004 bln
-20.807 mln
-1.03%
jan 1, 2011
2.218 bln
+214.287 mln
10.69%
jan 1, 2012
2.553 bln
+334.482 mln
15.08%
jan 1, 2013
1.938 bln
-615.313 mln
-24.1%
jan 1, 2014
2.245 bln
+307.231 mln
15.86%
jan 1, 2015
2.362 bln
+116.666 mln
5.2%
jan 1, 2016
2.54 bln
+178.154 mln
7.54%
Ranking of countries by current statistics by years


Comments: