29
/
en
AIzaSyAYiBZKx7MnpbEhh9jyipgxe19OcubqV5w
April 1, 2024
228291
Romania
ROU
true
2
1
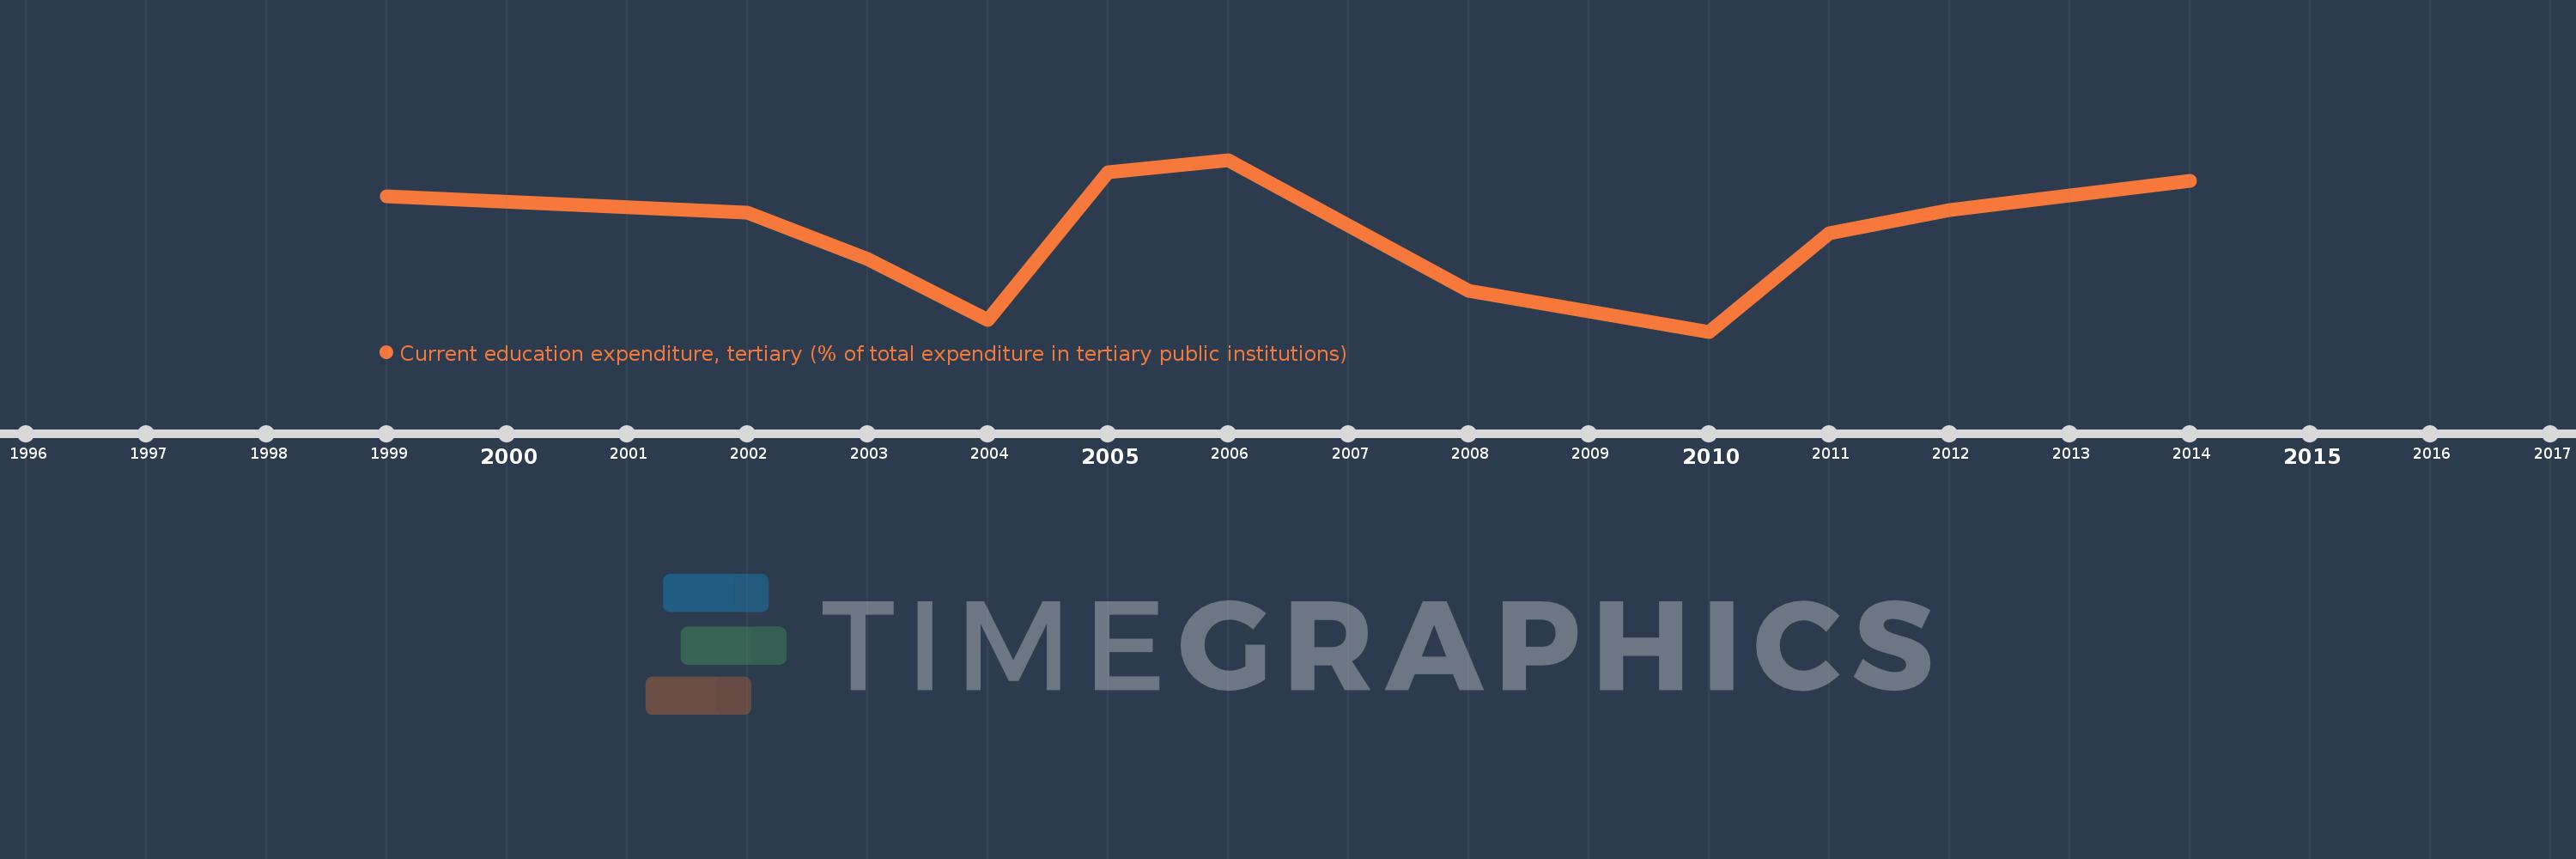
Current education expenditure, tertiary (% of total expenditure in tertiary public institutions)
2014,2013,2012,2011,2010,2008,2006,2005,2004,2003,2002,1999
This statistics in other country:
Timeline:
This timeline shows a graph from 1999 to 2014 of Romania. No data until 1998. Number of actual observations by date: 12.
Source name:
World Development Indicators
Source organization:
United Nations Educational, Scientific, and Cultural Organization (UNESCO) Institute for Statistics.
Categories, topics:
Education
Last updated:
apr 23, 2017
Indicators value changes by year
Minimum:
76.501
jan 1, 2010
Maximum:
92.483
jan 1, 2006
At the date of observation
Value
Absolute change
Change from previous value
jan 1, 1999
89.107
+89.107
0.0%
jan 1, 2002
87.598
-1.509
-1.69%
jan 1, 2003
83.268
-4.329
-4.94%
jan 1, 2004
77.604
-5.664
-6.8%
jan 1, 2005
91.333
+13.729
17.69%
jan 1, 2006
92.483
+1.15
1.26%
jan 1, 2008
80.307
-12.176
-13.17%
jan 1, 2010
76.501
-3.806
-4.74%
jan 1, 2011
85.676
+9.175
11.99%
jan 1, 2012
87.774
+2.099
2.45%
jan 1, 2013
89.152
+1.378
1.57%
jan 1, 2014
90.563
+1.411
1.58%
Ranking of countries by current statistics by years


Comments: