29
/
en
AIzaSyAYiBZKx7MnpbEhh9jyipgxe19OcubqV5w
April 1, 2024
73760
Austria
AUT
true
2
1
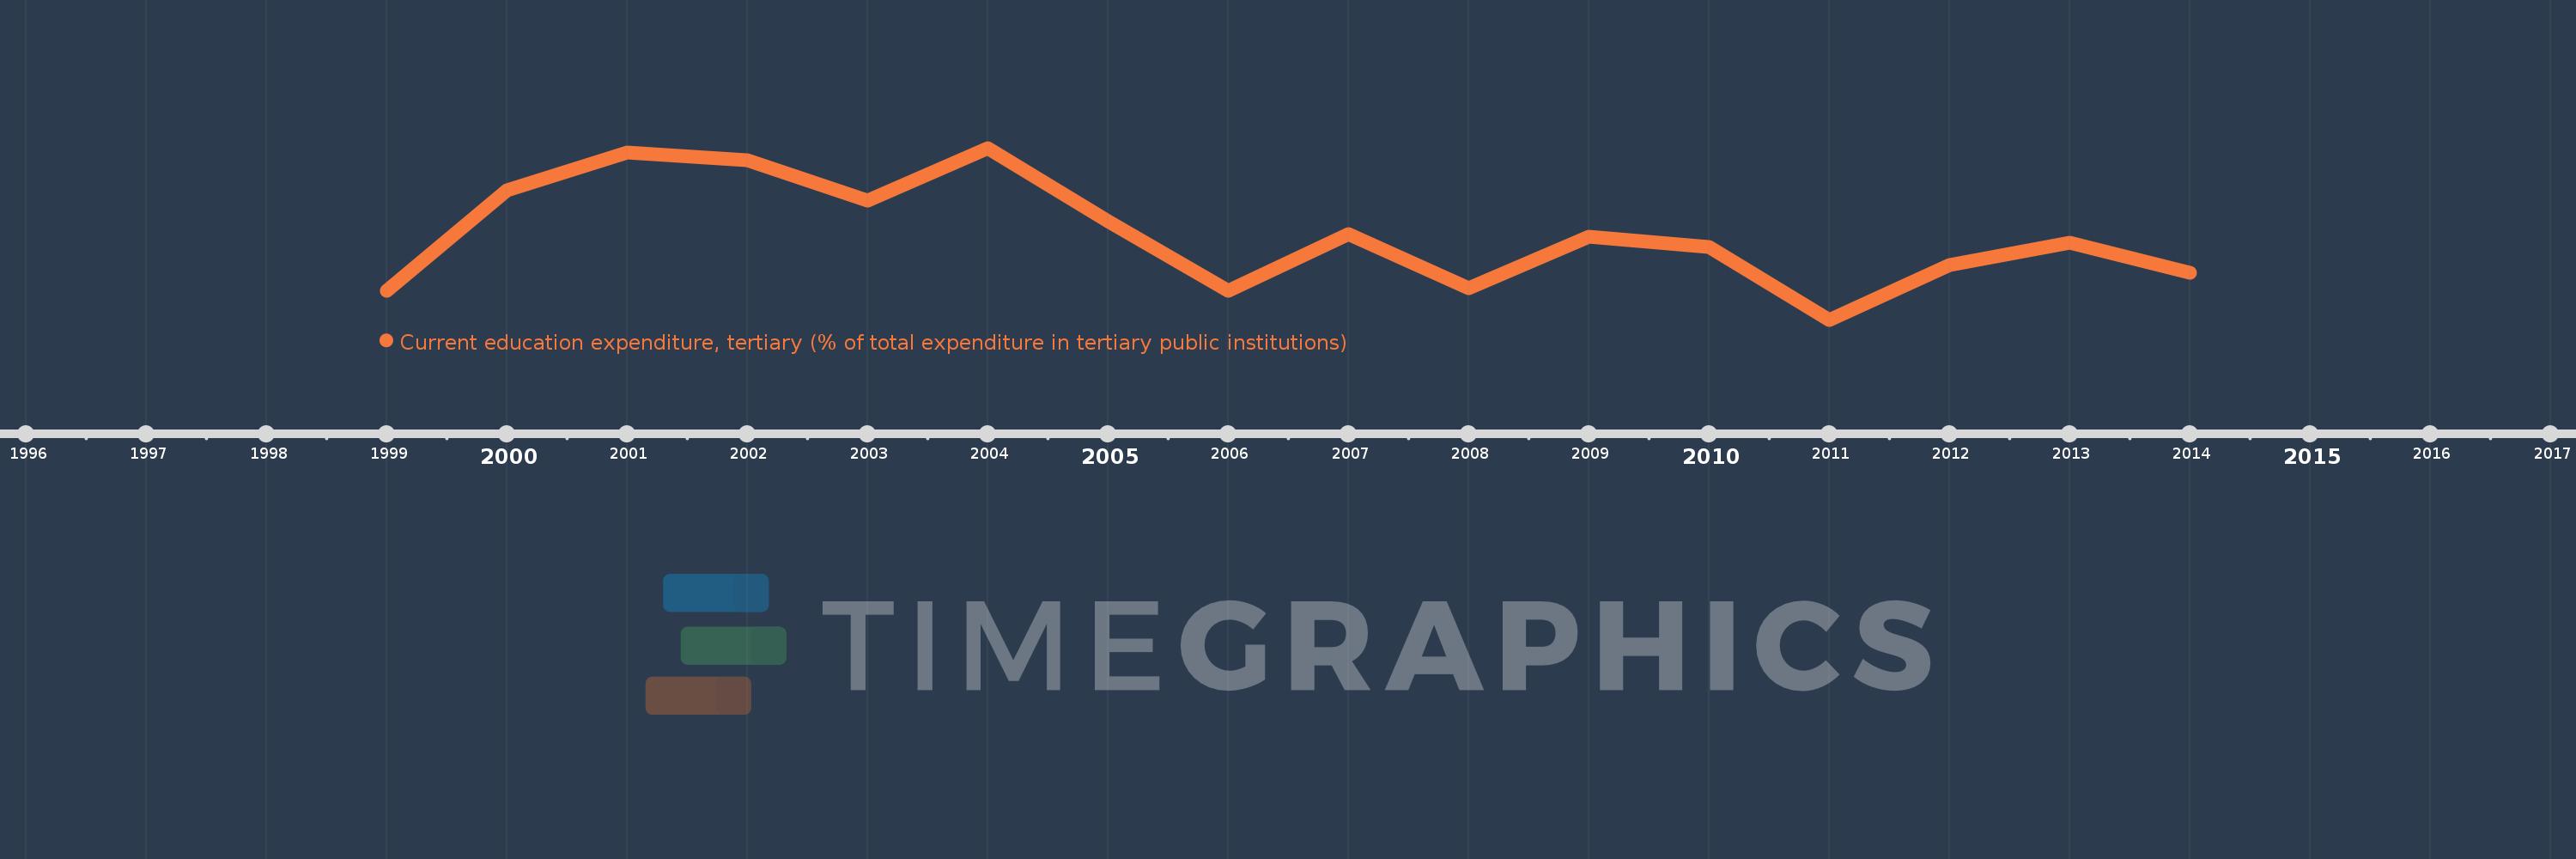
Current education expenditure, tertiary (% of total expenditure in tertiary public institutions)
2014,2013,2012,2011,2010,2009,2008,2007,2006,2005,2004,2003,2002,2001,2000,1999
This statistics in other country:
Timeline:
This timeline shows a graph from 1999 to 2014 of Austria. No data until 1998. Number of actual observations by date: 16.
Source name:
World Development Indicators
Source organization:
United Nations Educational, Scientific, and Cultural Organization (UNESCO) Institute for Statistics.
Categories, topics:
Education
Last updated:
apr 23, 2017
Indicators value changes by year
Minimum:
90.639
jan 1, 2011
Maximum:
96.926
jan 1, 2004
At the date of observation
Value
Absolute change
Change from previous value
jan 1, 1999
91.701
+91.701
0.0%
jan 1, 2000
95.369
+3.668
4.0%
jan 1, 2001
96.754
+1.385
1.45%
jan 1, 2002
96.483
-0.271
-0.28%
jan 1, 2003
94.99
-1.494
-1.55%
jan 1, 2004
96.926
+1.936
2.04%
jan 1, 2005
94.235
-2.691
-2.78%
jan 1, 2006
91.694
-2.541
-2.7%
jan 1, 2007
93.784
+2.09
2.28%
jan 1, 2008
91.788
-1.997
-2.13%
jan 1, 2009
93.676
+1.888
2.06%
jan 1, 2010
93.303
-0.372
-0.4%
jan 1, 2011
90.639
-2.664
-2.86%
jan 1, 2012
92.646
+2.007
2.21%
jan 1, 2013
93.462
+0.816
0.88%
jan 1, 2014
92.365
-1.097
-1.17%
Ranking of countries by current statistics by years


Comments: