29
/
en
AIzaSyAYiBZKx7MnpbEhh9jyipgxe19OcubqV5w
April 1, 2024
223372
Philippines
PHL
true
2
1
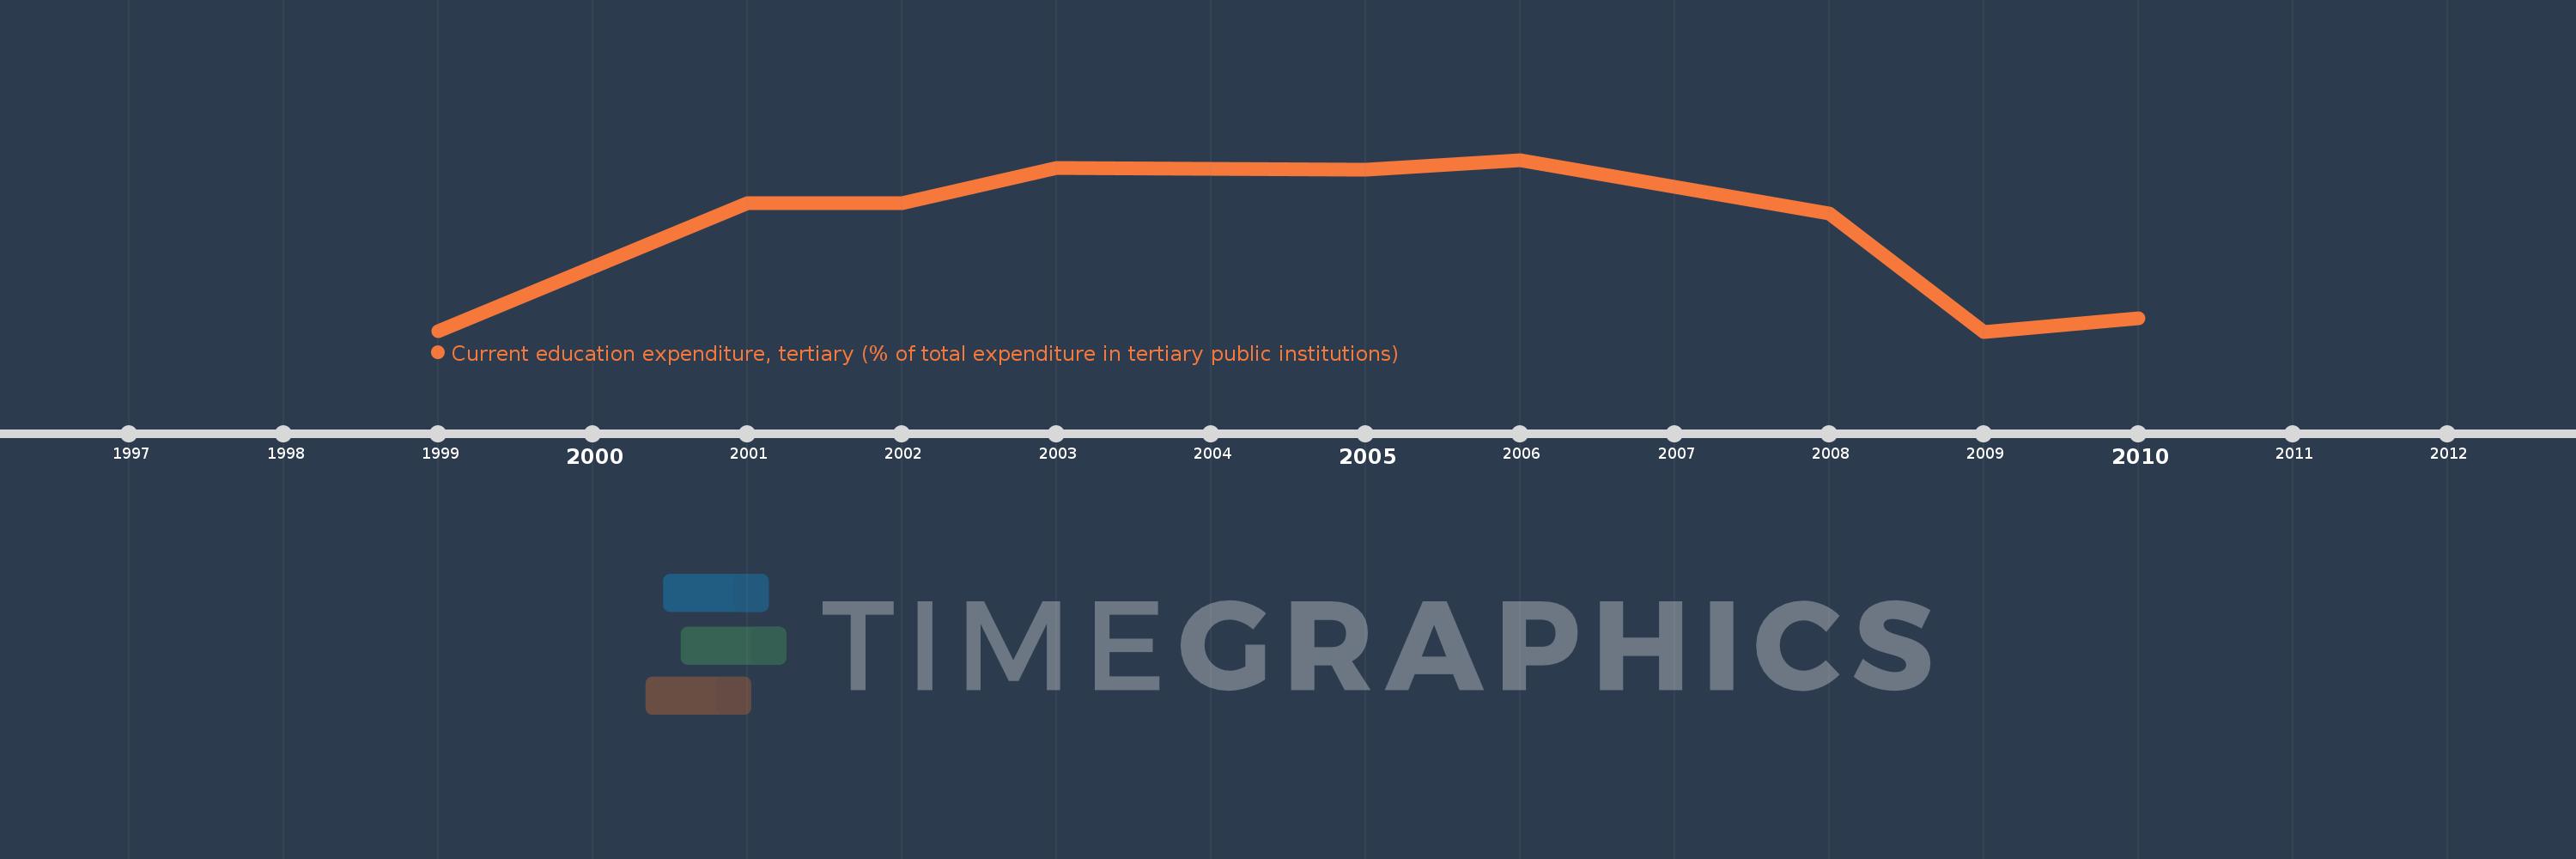
Current education expenditure, tertiary (% of total expenditure in tertiary public institutions)
2010,2009,2008,2006,2005,2004,2003,2002,2001,1999
This statistics in other country:
Timeline:
This timeline shows a graph from 1999 to 2010 of Philippines. No data until 1998. Number of actual observations by date: 10.
Source name:
World Development Indicators
Source organization:
United Nations Educational, Scientific, and Cultural Organization (UNESCO) Institute for Statistics.
Categories, topics:
Education
Last updated:
apr 23, 2017
Indicators value changes by year
Maximum:
98.386
jan 1, 2006
At the date of observation
Value
Absolute change
Change from previous value
jan 1, 1999
86.609
+86.609
0.0%
jan 1, 2001
95.413
+8.804
10.17%
jan 1, 2002
95.413
0.0
0.0%
jan 1, 2003
97.81
+2.396
2.51%
jan 1, 2004
97.736
-0.073
-0.08%
jan 1, 2005
97.715
-0.021
-0.02%
jan 1, 2006
98.386
+0.67
0.69%
jan 1, 2008
94.662
-3.724
-3.78%
jan 1, 2009
86.55
-8.112
-8.57%
jan 1, 2010
87.464
+0.914
1.06%
Ranking of countries by current statistics by years


Comments: