29
/
en
AIzaSyAYiBZKx7MnpbEhh9jyipgxe19OcubqV5w
April 1, 2024
35631
High income
HIC
false
2
1
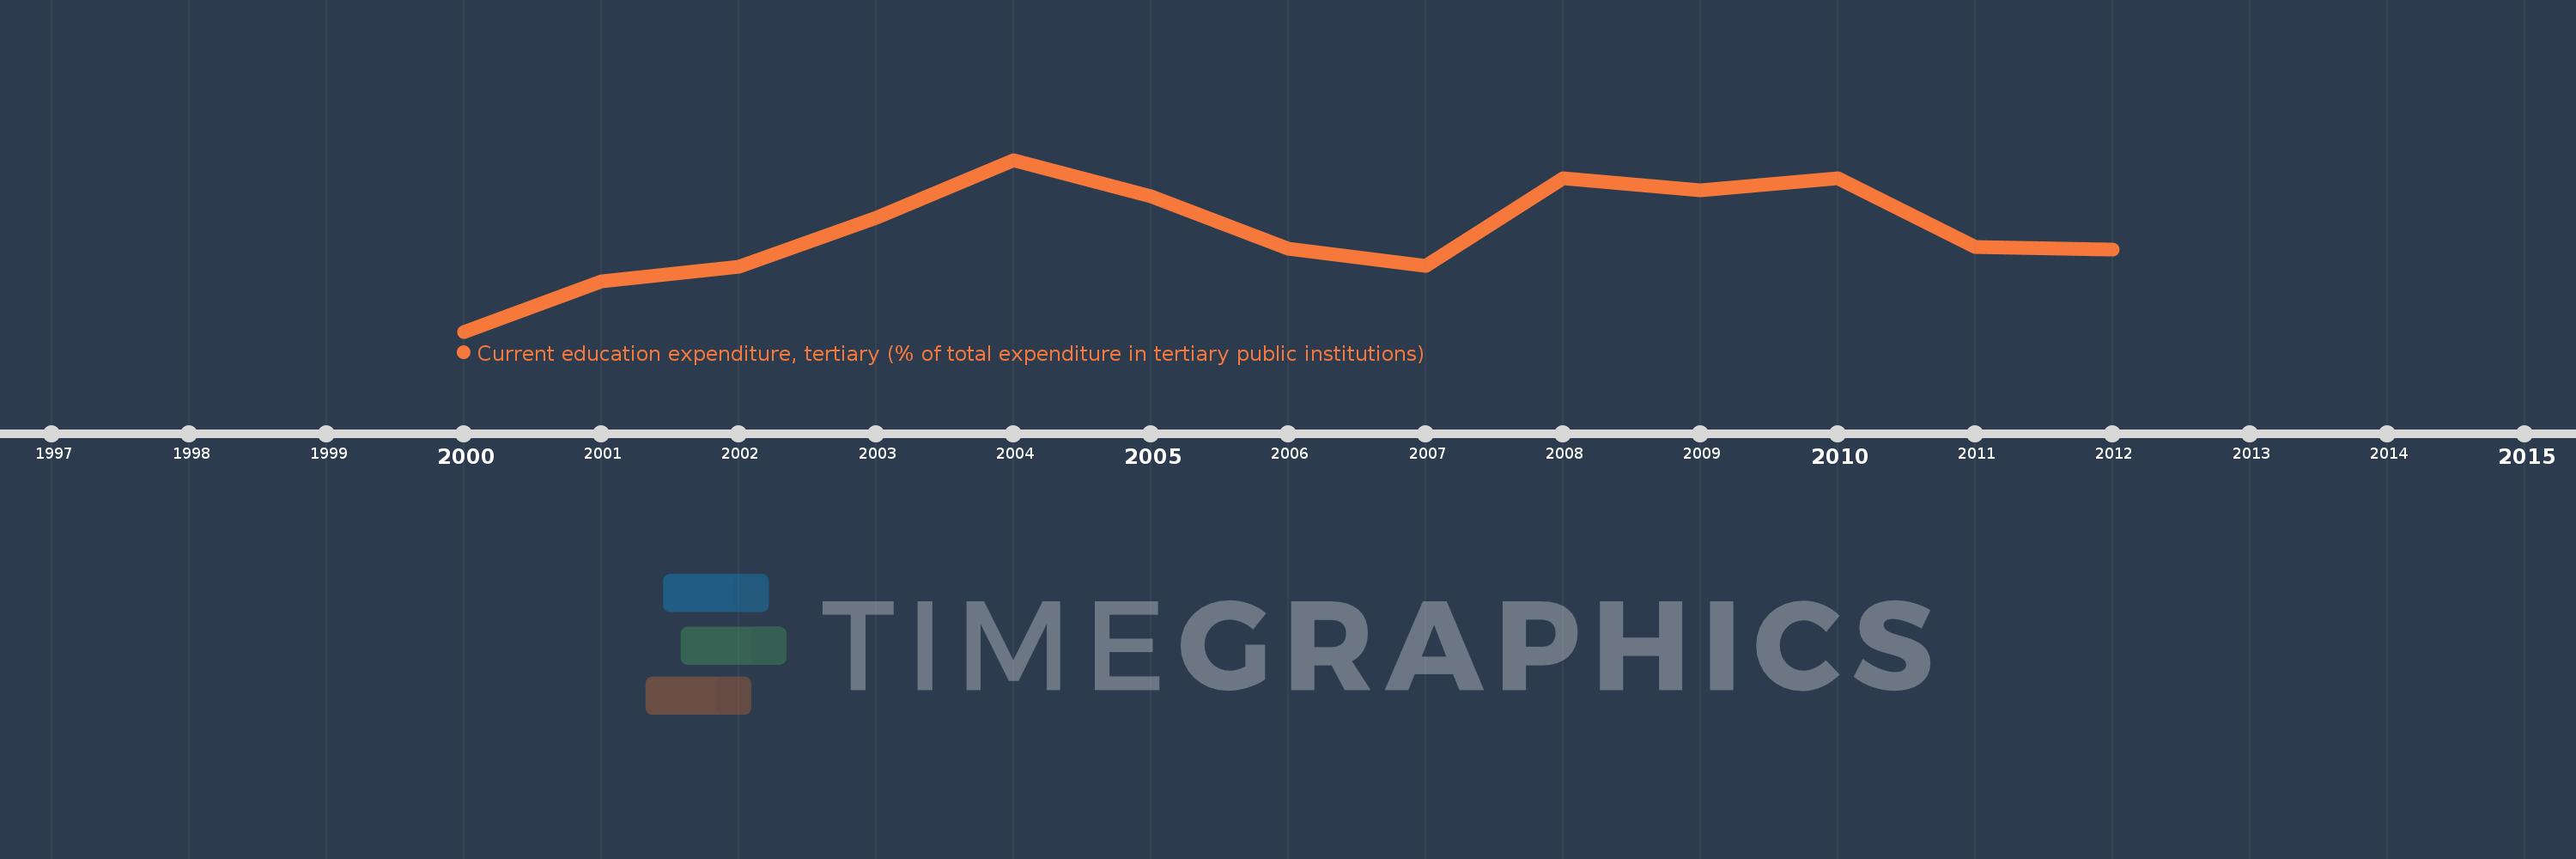
Current education expenditure, tertiary (% of total expenditure in tertiary public institutions)
2012,2011,2010,2009,2008,2007,2006,2005,2004,2003,2002,2001,2000
This statistics in other country:
Timeline:
This timeline shows a graph from 2000 to 2012 of High income. No data until 1999. Number of actual observations by date: 13.
Source name:
World Development Indicators
Source organization:
United Nations Educational, Scientific, and Cultural Organization (UNESCO) Institute for Statistics.
Categories, topics:
Education
Last updated:
apr 23, 2017
Indicators value changes by year
Minimum:
88.275
jan 1, 2000
Maximum:
91.135
jan 1, 2004
At the date of observation
Value
Absolute change
Change from previous value
jan 1, 2000
88.275
+88.275
0.0%
jan 1, 2001
89.108
+0.834
0.94%
jan 1, 2002
89.361
+0.253
0.28%
jan 1, 2003
90.171
+0.81
0.91%
jan 1, 2004
91.135
+0.964
1.07%
jan 1, 2005
90.522
-0.614
-0.67%
jan 1, 2006
89.659
-0.862
-0.95%
jan 1, 2007
89.372
-0.288
-0.32%
jan 1, 2008
90.832
+1.46
1.63%
jan 1, 2009
90.628
-0.203
-0.22%
jan 1, 2010
90.823
+0.195
0.21%
jan 1, 2011
89.684
-1.139
-1.25%
jan 1, 2012
89.646
-0.038
-0.04%
Ranking of countries by current statistics by years


Comments: