29
/
en
AIzaSyAYiBZKx7MnpbEhh9jyipgxe19OcubqV5w
April 1, 2024
152365
Hungary
HUN
true
2
1
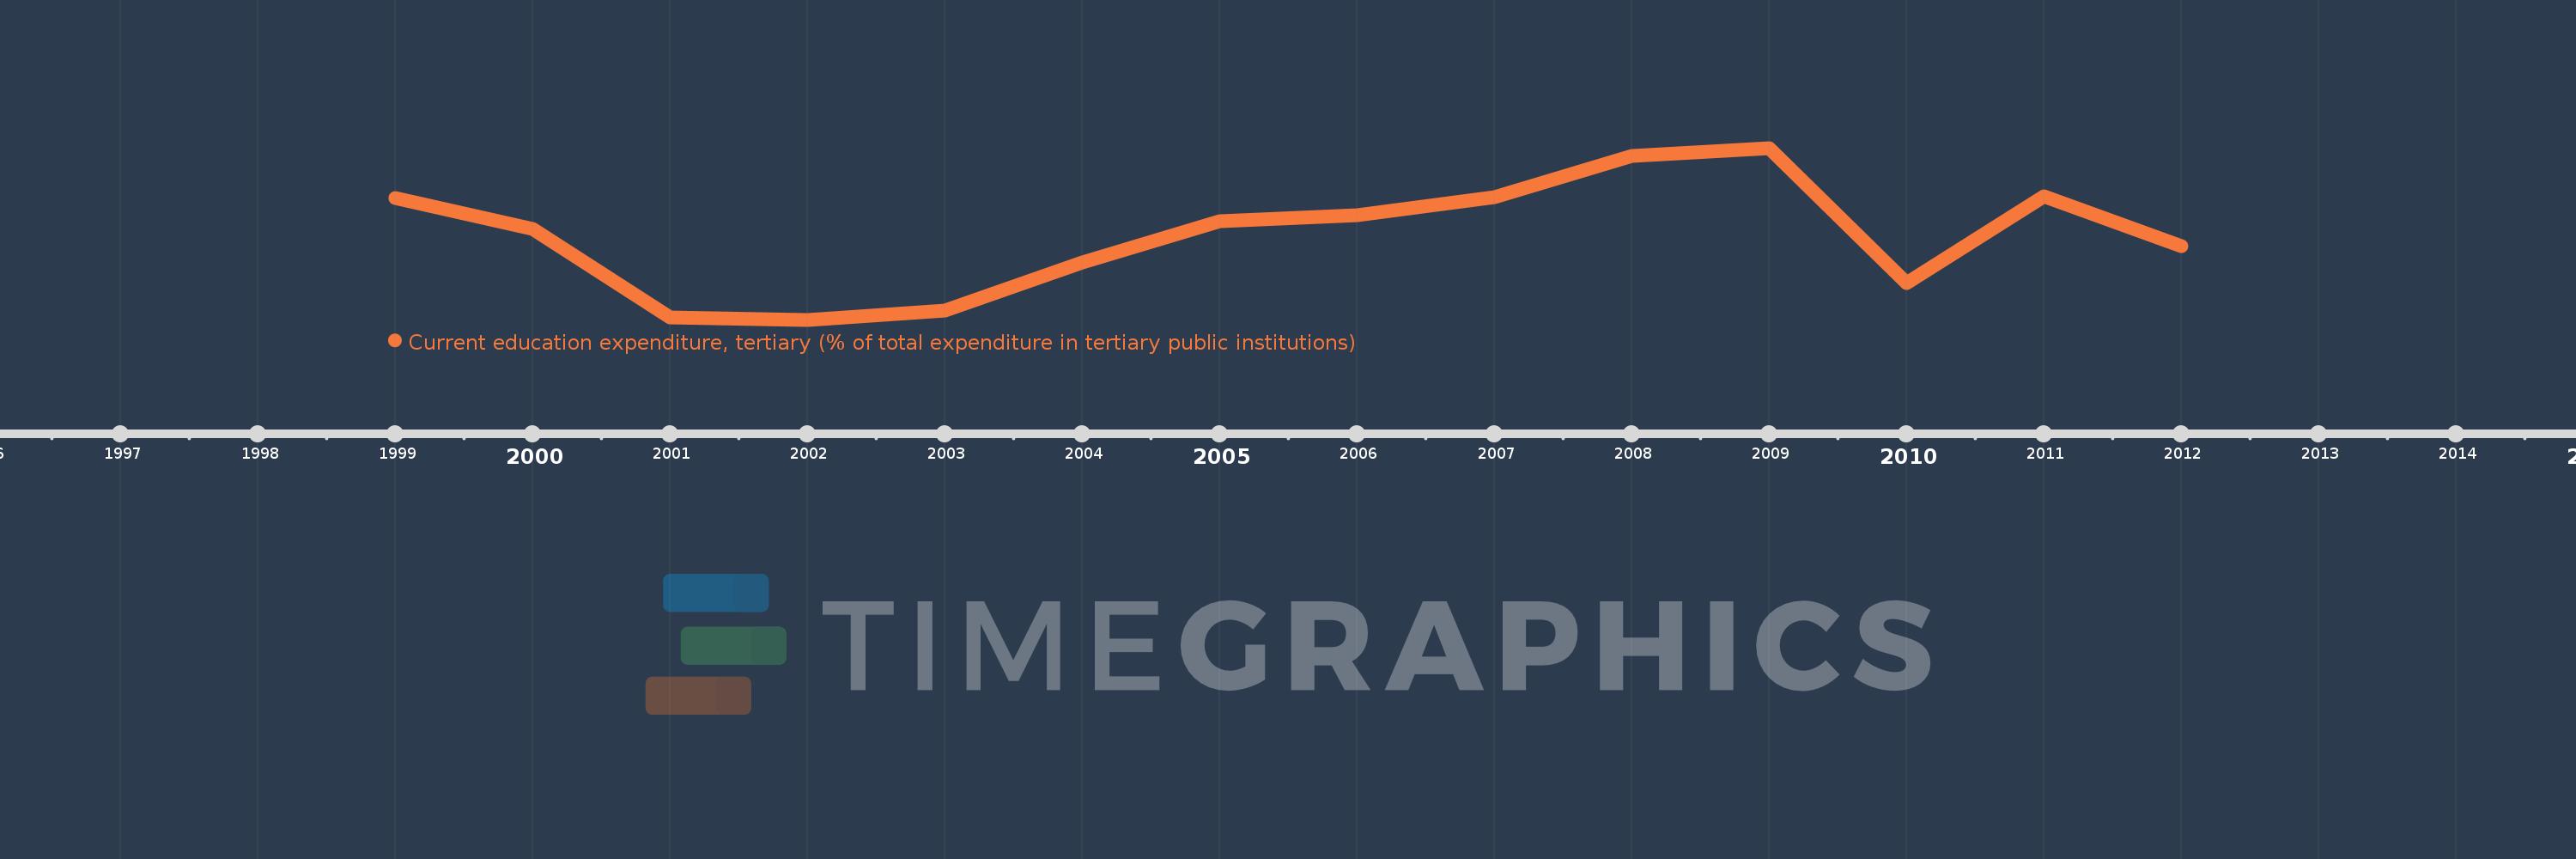
Current education expenditure, tertiary (% of total expenditure in tertiary public institutions)
2012,2011,2010,2009,2008,2007,2006,2005,2004,2003,2002,2001,2000,1999
This statistics in other country:
Timeline:
This timeline shows a graph from 1999 to 2012 of Hungary. No data until 1998. Number of actual observations by date: 14.
Source name:
World Development Indicators
Source organization:
United Nations Educational, Scientific, and Cultural Organization (UNESCO) Institute for Statistics.
Categories, topics:
Education
Last updated:
apr 23, 2017
Indicators value changes by year
Minimum:
82.237
jan 1, 2002
Maximum:
91.023
jan 1, 2009
At the date of observation
Value
Absolute change
Change from previous value
jan 1, 1999
88.444
+88.444
0.0%
jan 1, 2000
86.872
-1.572
-1.78%
jan 1, 2001
82.373
-4.499
-5.18%
jan 1, 2002
82.237
-0.136
-0.17%
jan 1, 2003
82.689
+0.452
0.55%
jan 1, 2004
85.173
+2.484
3.0%
jan 1, 2005
87.289
+2.115
2.48%
jan 1, 2006
87.57
+0.281
0.32%
jan 1, 2007
88.513
+0.943
1.08%
jan 1, 2008
90.598
+2.085
2.36%
jan 1, 2009
91.023
+0.425
0.47%
jan 1, 2010
84.116
-6.906
-7.59%
jan 1, 2011
88.564
+4.448
5.29%
jan 1, 2012
86.021
-2.543
-2.87%
Ranking of countries by current statistics by years


Comments: