29
/
en
AIzaSyAYiBZKx7MnpbEhh9jyipgxe19OcubqV5w
April 1, 2024
264426
Togo
TGO
true
2
1
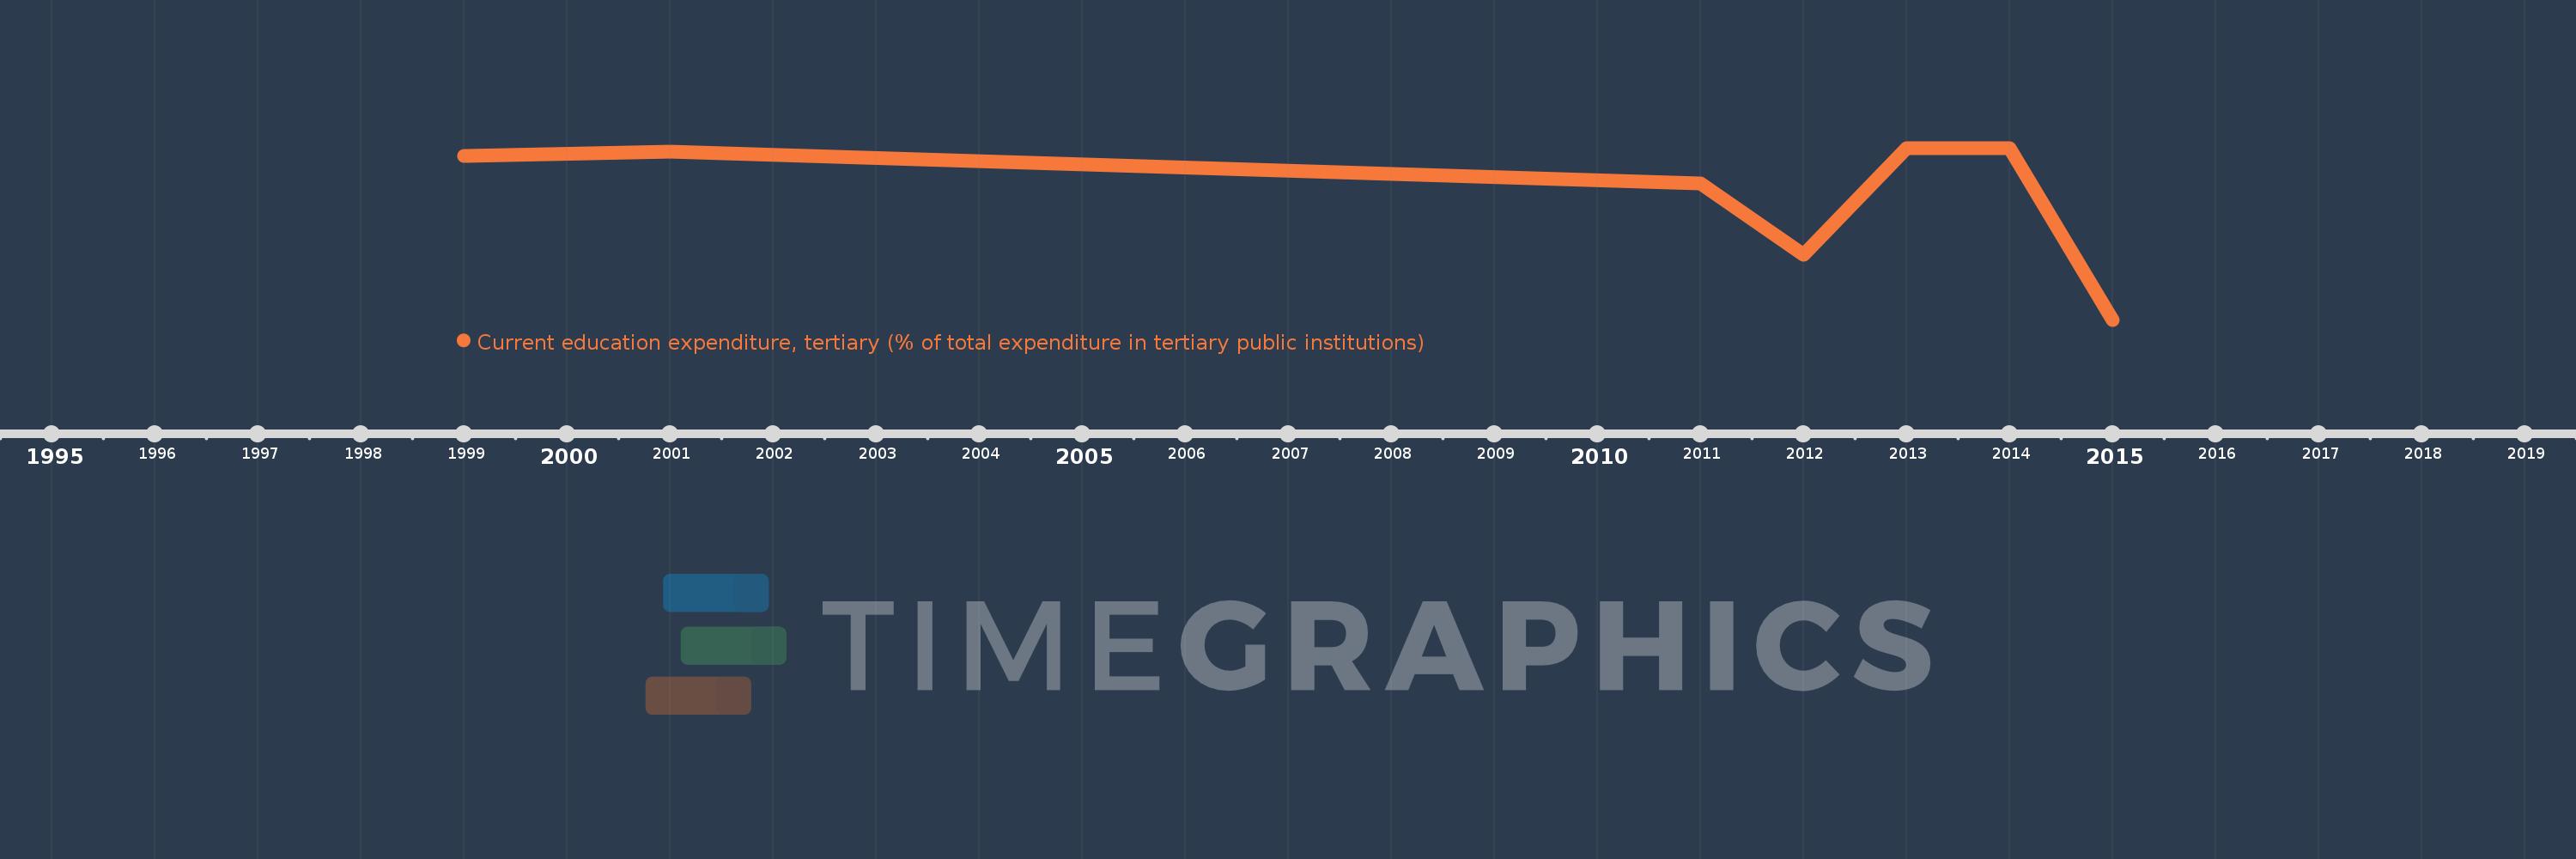
Current education expenditure, tertiary (% of total expenditure in tertiary public institutions)
2015,2014,2013,2012,2011,2001,1999
This statistics in other country:
Timeline:
This timeline shows a graph from 1999 to 2015 of Togo. No data until 1998. Number of actual observations by date: 7.
Source name:
World Development Indicators
Source organization:
United Nations Educational, Scientific, and Cultural Organization (UNESCO) Institute for Statistics.
Categories, topics:
Education
Last updated:
apr 23, 2017
Indicators value changes by year
Minimum:
88.388
jan 1, 2015
At the date of observation
Value
Absolute change
Change from previous value
jan 1, 1999
99.446
+99.446
0.0%
jan 1, 2001
99.723
+0.277
0.28%
jan 1, 2011
97.592
-2.131
-2.14%
jan 1, 2012
92.778
-4.815
-4.93%
jan 1, 2013
100.0
+7.222
7.78%
jan 1, 2014
100.0
0.0
0.0%
jan 1, 2015
88.388
-11.612
-11.61%
Ranking of countries by current statistics by years


Comments: