29
/
en
AIzaSyAYiBZKx7MnpbEhh9jyipgxe19OcubqV5w
April 1, 2024
147796
Guyana
GUY
true
2
1
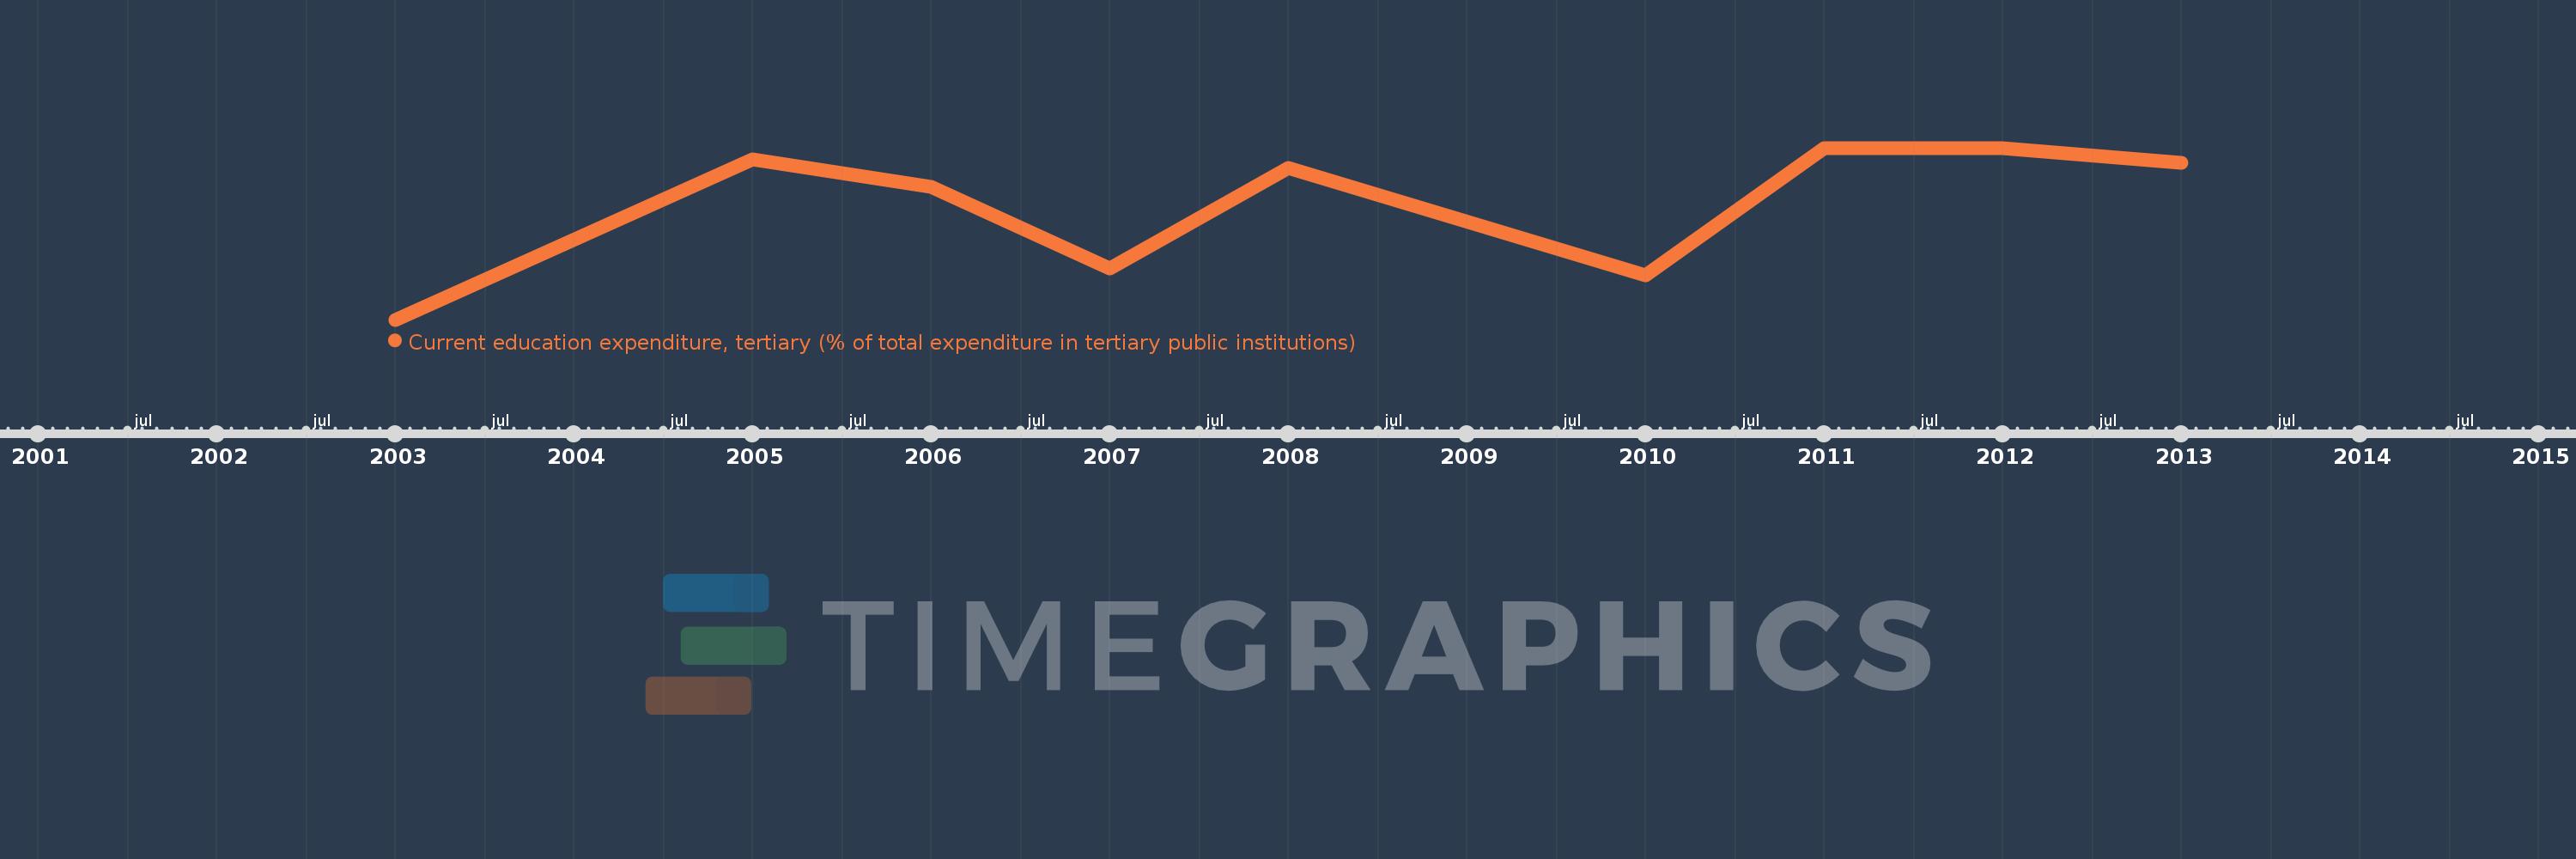
Current education expenditure, tertiary (% of total expenditure in tertiary public institutions)
2013,2012,2011,2010,2008,2007,2006,2005,2003
This statistics in other country:
Timeline:
This timeline shows a graph from 2003 to 2013 of Guyana. No data until 2002. Number of actual observations by date: 9.
Source name:
World Development Indicators
Source organization:
United Nations Educational, Scientific, and Cultural Organization (UNESCO) Institute for Statistics.
Categories, topics:
Education
Last updated:
apr 23, 2017
Indicators value changes by year
Minimum:
82.604
jan 1, 2003
Maximum:
94.126
jan 1, 2012
At the date of observation
Value
Absolute change
Change from previous value
jan 1, 2003
82.604
+82.604
0.0%
jan 1, 2005
93.35
+10.746
13.01%
jan 1, 2006
91.494
-1.856
-1.99%
jan 1, 2007
86.041
-5.453
-5.96%
jan 1, 2008
92.776
+6.735
7.83%
jan 1, 2010
85.57
-7.206
-7.77%
jan 1, 2011
94.082
+8.512
9.95%
jan 1, 2012
94.126
+0.044
0.05%
jan 1, 2013
93.132
-0.994
-1.06%
Ranking of countries by current statistics by years


Comments: