29
/
en
AIzaSyAYiBZKx7MnpbEhh9jyipgxe19OcubqV5w
April 1, 2024
132995
Finland
FIN
true
2
1
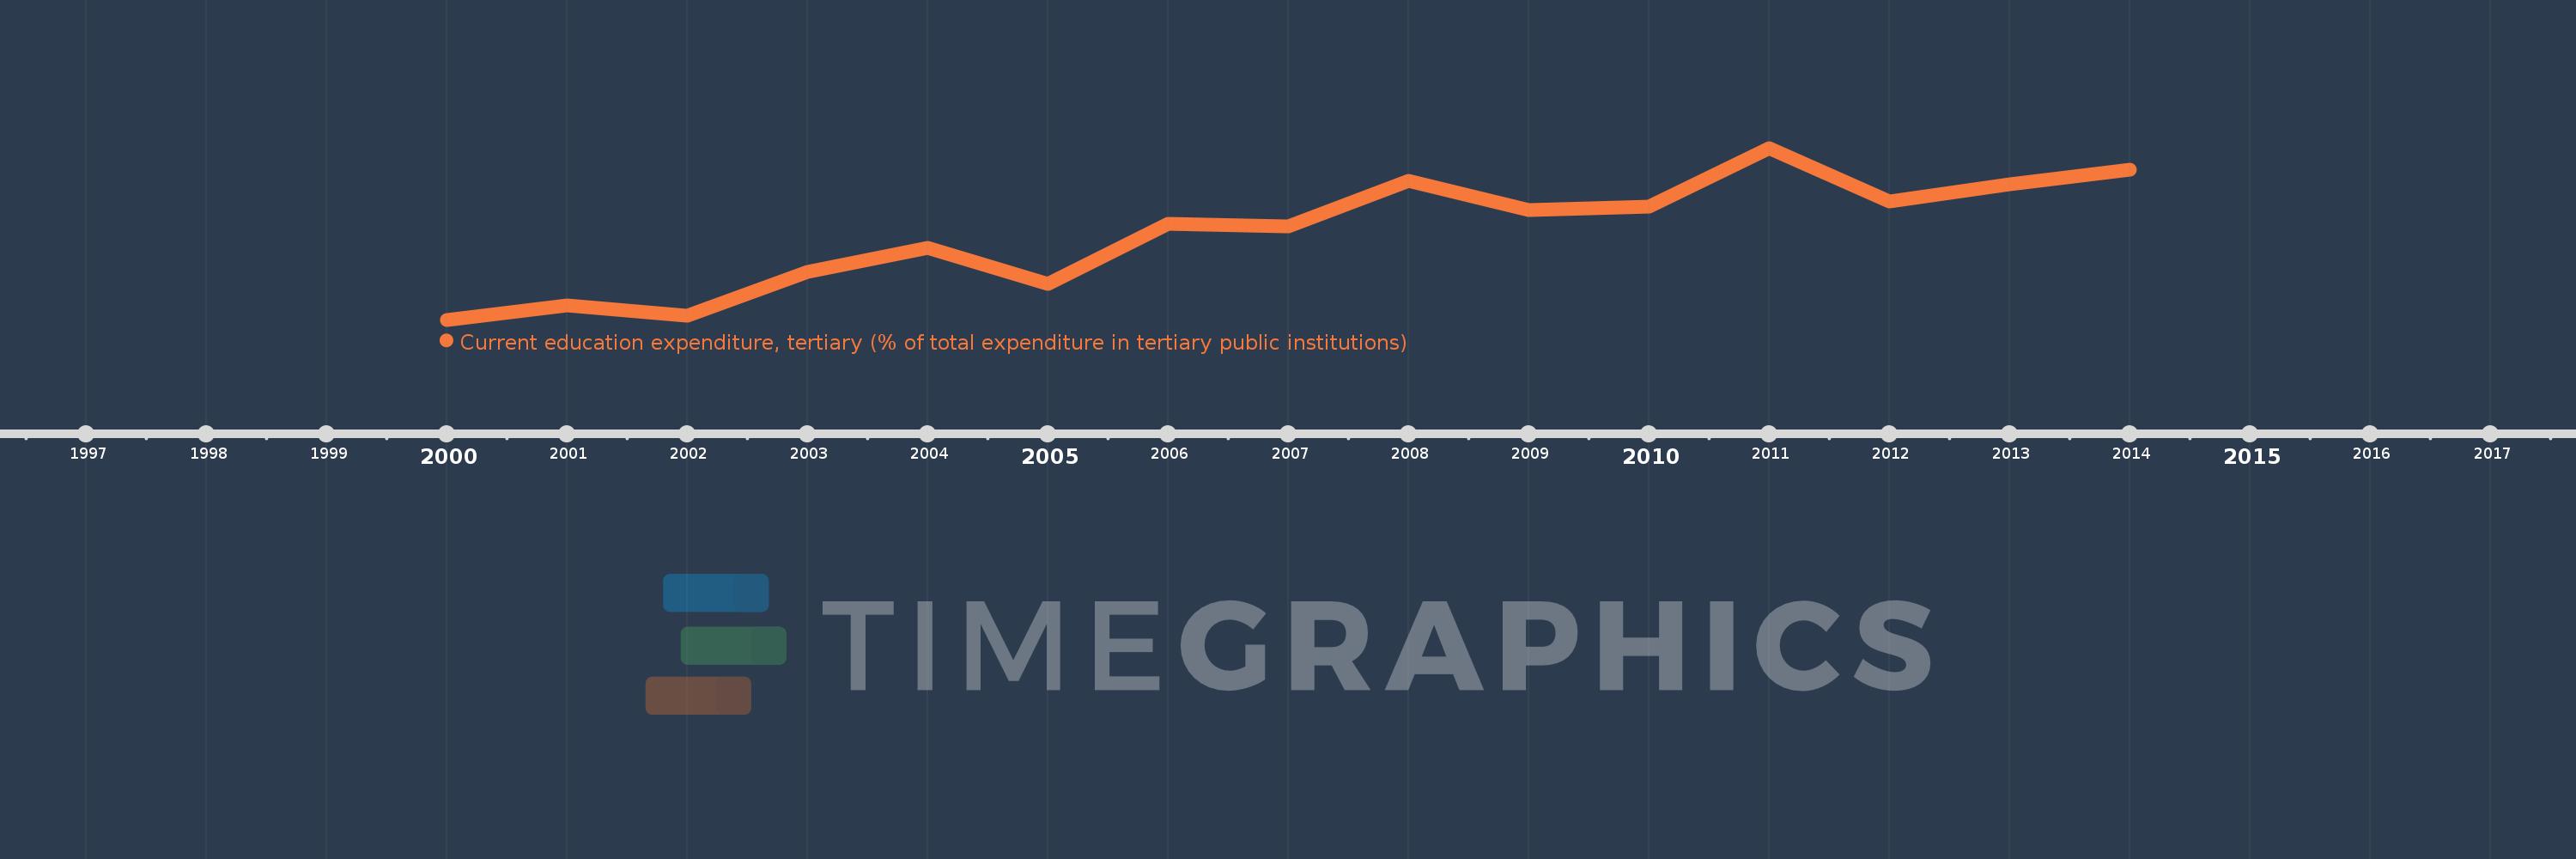
Current education expenditure, tertiary (% of total expenditure in tertiary public institutions)
2014,2013,2012,2011,2010,2009,2008,2007,2006,2005,2004,2003,2002,2001,2000
This statistics in other country:
Timeline:
This timeline shows a graph from 2000 to 2014 of Finland. No data until 1999. Number of actual observations by date: 15.
Source name:
World Development Indicators
Source organization:
United Nations Educational, Scientific, and Cultural Organization (UNESCO) Institute for Statistics.
Categories, topics:
Education
Last updated:
apr 23, 2017
Indicators value changes by year
Minimum:
93.166
jan 1, 2000
Maximum:
97.577
jan 1, 2011
At the date of observation
Value
Absolute change
Change from previous value
jan 1, 2000
93.166
+93.166
0.0%
jan 1, 2001
93.54
+0.374
0.4%
jan 1, 2002
93.268
-0.272
-0.29%
jan 1, 2003
94.4
+1.132
1.21%
jan 1, 2004
95.013
+0.614
0.65%
jan 1, 2005
94.095
-0.919
-0.97%
jan 1, 2006
95.635
+1.541
1.64%
jan 1, 2007
95.574
-0.061
-0.06%
jan 1, 2008
96.724
+1.15
1.2%
jan 1, 2009
95.988
-0.736
-0.76%
jan 1, 2010
96.074
+0.086
0.09%
jan 1, 2011
97.577
+1.503
1.56%
jan 1, 2012
96.213
-1.364
-1.4%
jan 1, 2013
96.654
+0.441
0.46%
jan 1, 2014
97.009
+0.354
0.37%
Ranking of countries by current statistics by years


Comments: