29
/
en
AIzaSyAYiBZKx7MnpbEhh9jyipgxe19OcubqV5w
April 1, 2024
141649
Greece
GRC
true
2
1
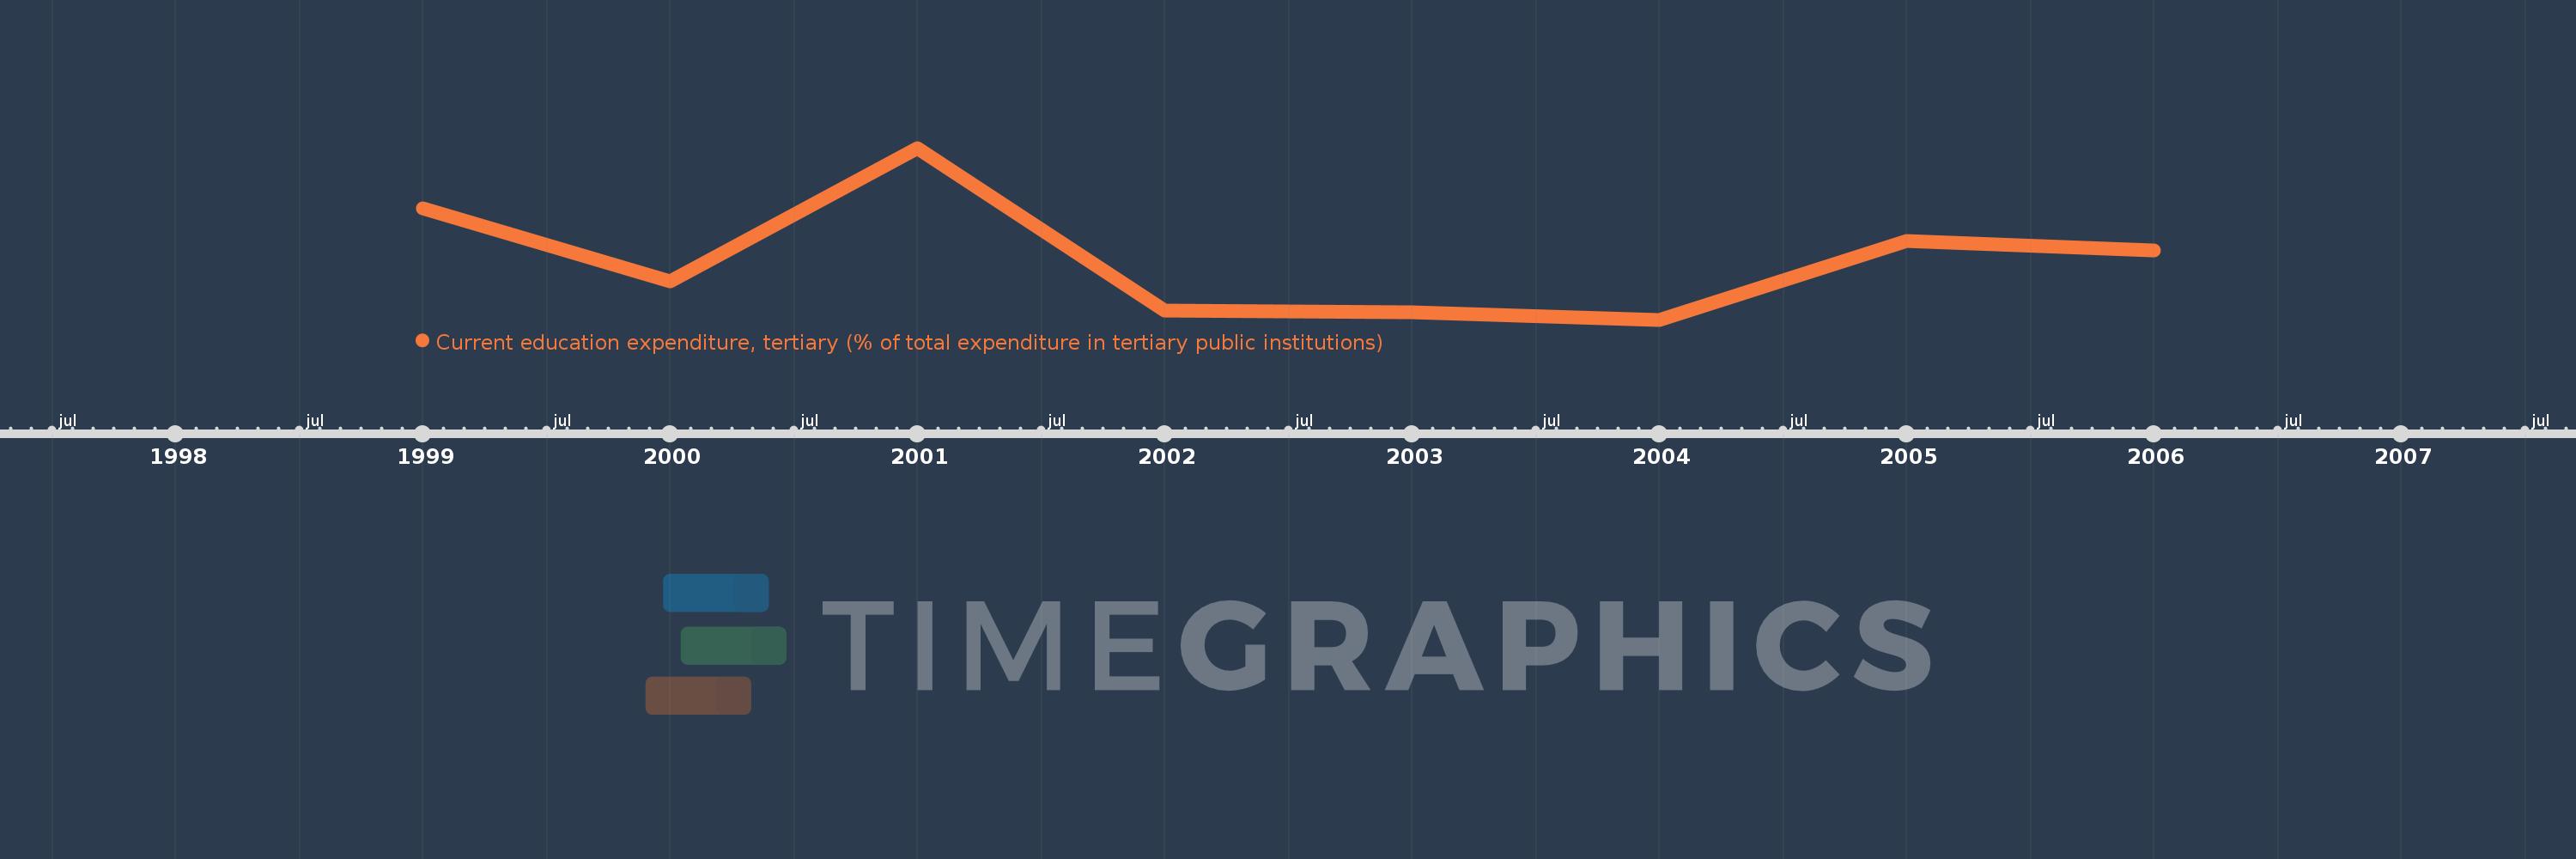
Current education expenditure, tertiary (% of total expenditure in tertiary public institutions)
2006,2005,2004,2003,2002,2001,2000,1999
This statistics in other country:
Timeline:
This timeline shows a graph from 1999 to 2006 of Greece. No data until 1998. Number of actual observations by date: 8.
Source name:
World Development Indicators
Source organization:
United Nations Educational, Scientific, and Cultural Organization (UNESCO) Institute for Statistics.
Categories, topics:
Education
Last updated:
apr 23, 2017
Indicators value changes by year
At the date of observation
Value
Absolute change
Change from previous value
jan 1, 1999
69.875
+69.875
0.0%
jan 1, 2000
62.913
-6.962
-9.96%
jan 1, 2001
75.62
+12.706
20.2%
jan 1, 2002
60.094
-15.525
-20.53%
jan 1, 2003
59.921
-0.173
-0.29%
jan 1, 2004
59.22
-0.701
-1.17%
jan 1, 2005
66.727
+7.507
12.68%
jan 1, 2006
65.842
-0.885
-1.33%
Ranking of countries by current statistics by years


Comments: