29
/
en
AIzaSyAYiBZKx7MnpbEhh9jyipgxe19OcubqV5w
April 1, 2024
140201
Ghana
GHA
true
2
1
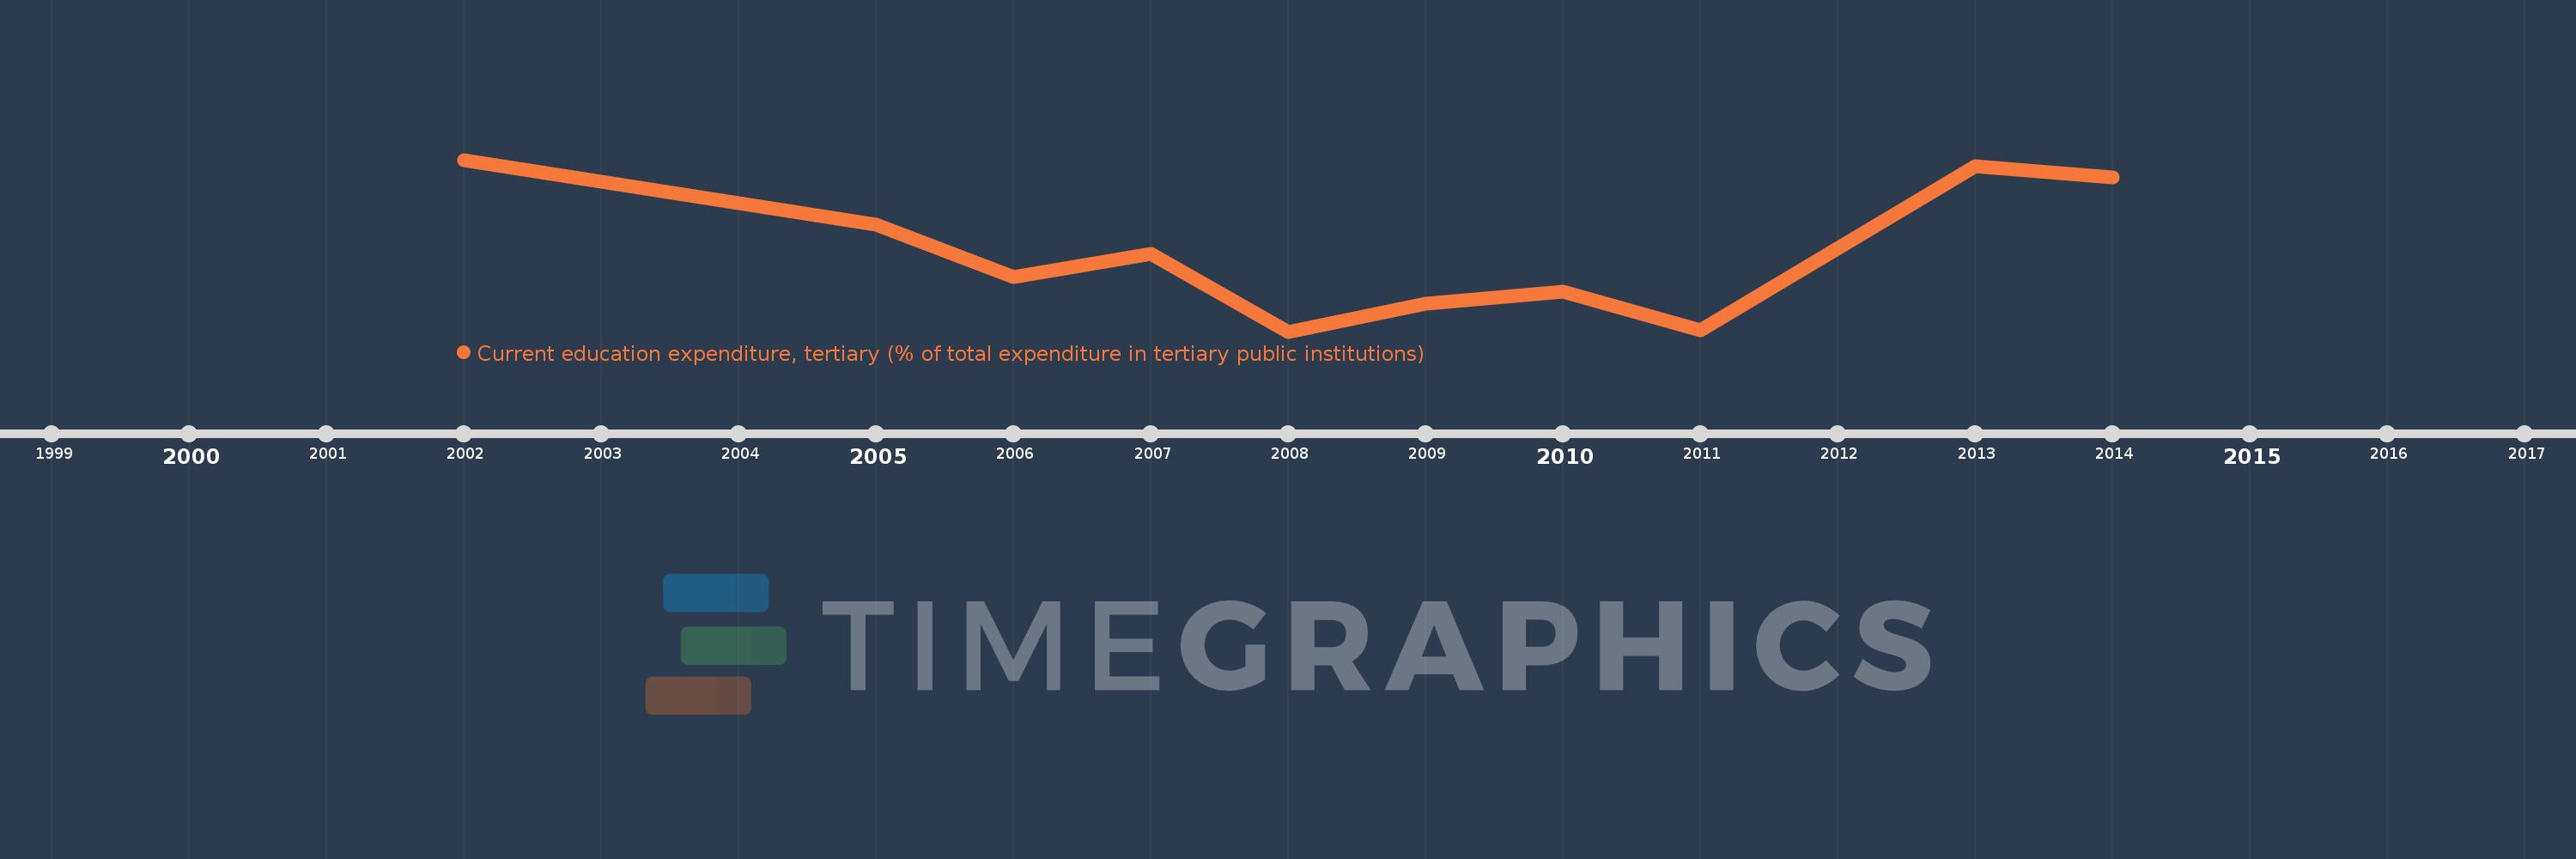
Current education expenditure, tertiary (% of total expenditure in tertiary public institutions)
2014,2013,2011,2010,2009,2008,2007,2006,2005,2002
This statistics in other country:
Timeline:
This timeline shows a graph from 2002 to 2014 of Ghana. No data until 2001. Number of actual observations by date: 10.
Source name:
World Development Indicators
Source organization:
United Nations Educational, Scientific, and Cultural Organization (UNESCO) Institute for Statistics.
Categories, topics:
Education
Last updated:
apr 23, 2017
Indicators value changes by year
Minimum:
73.125
jan 1, 2008
Maximum:
99.672
jan 1, 2002
At the date of observation
Value
Absolute change
Change from previous value
jan 1, 2002
99.672
+99.672
0.0%
jan 1, 2005
89.617
-10.054
-10.09%
jan 1, 2006
81.528
-8.089
-9.03%
jan 1, 2007
85.139
+3.611
4.43%
jan 1, 2008
73.125
-12.014
-14.11%
jan 1, 2009
77.429
+4.304
5.89%
jan 1, 2010
79.27
+1.841
2.38%
jan 1, 2011
73.313
-5.957
-7.51%
jan 1, 2013
98.649
+25.336
34.56%
jan 1, 2014
96.898
-1.752
-1.78%
Ranking of countries by current statistics by years


Comments: