29
/
en
AIzaSyAYiBZKx7MnpbEhh9jyipgxe19OcubqV5w
April 1, 2024
118759
Denmark
DNK
true
2
1
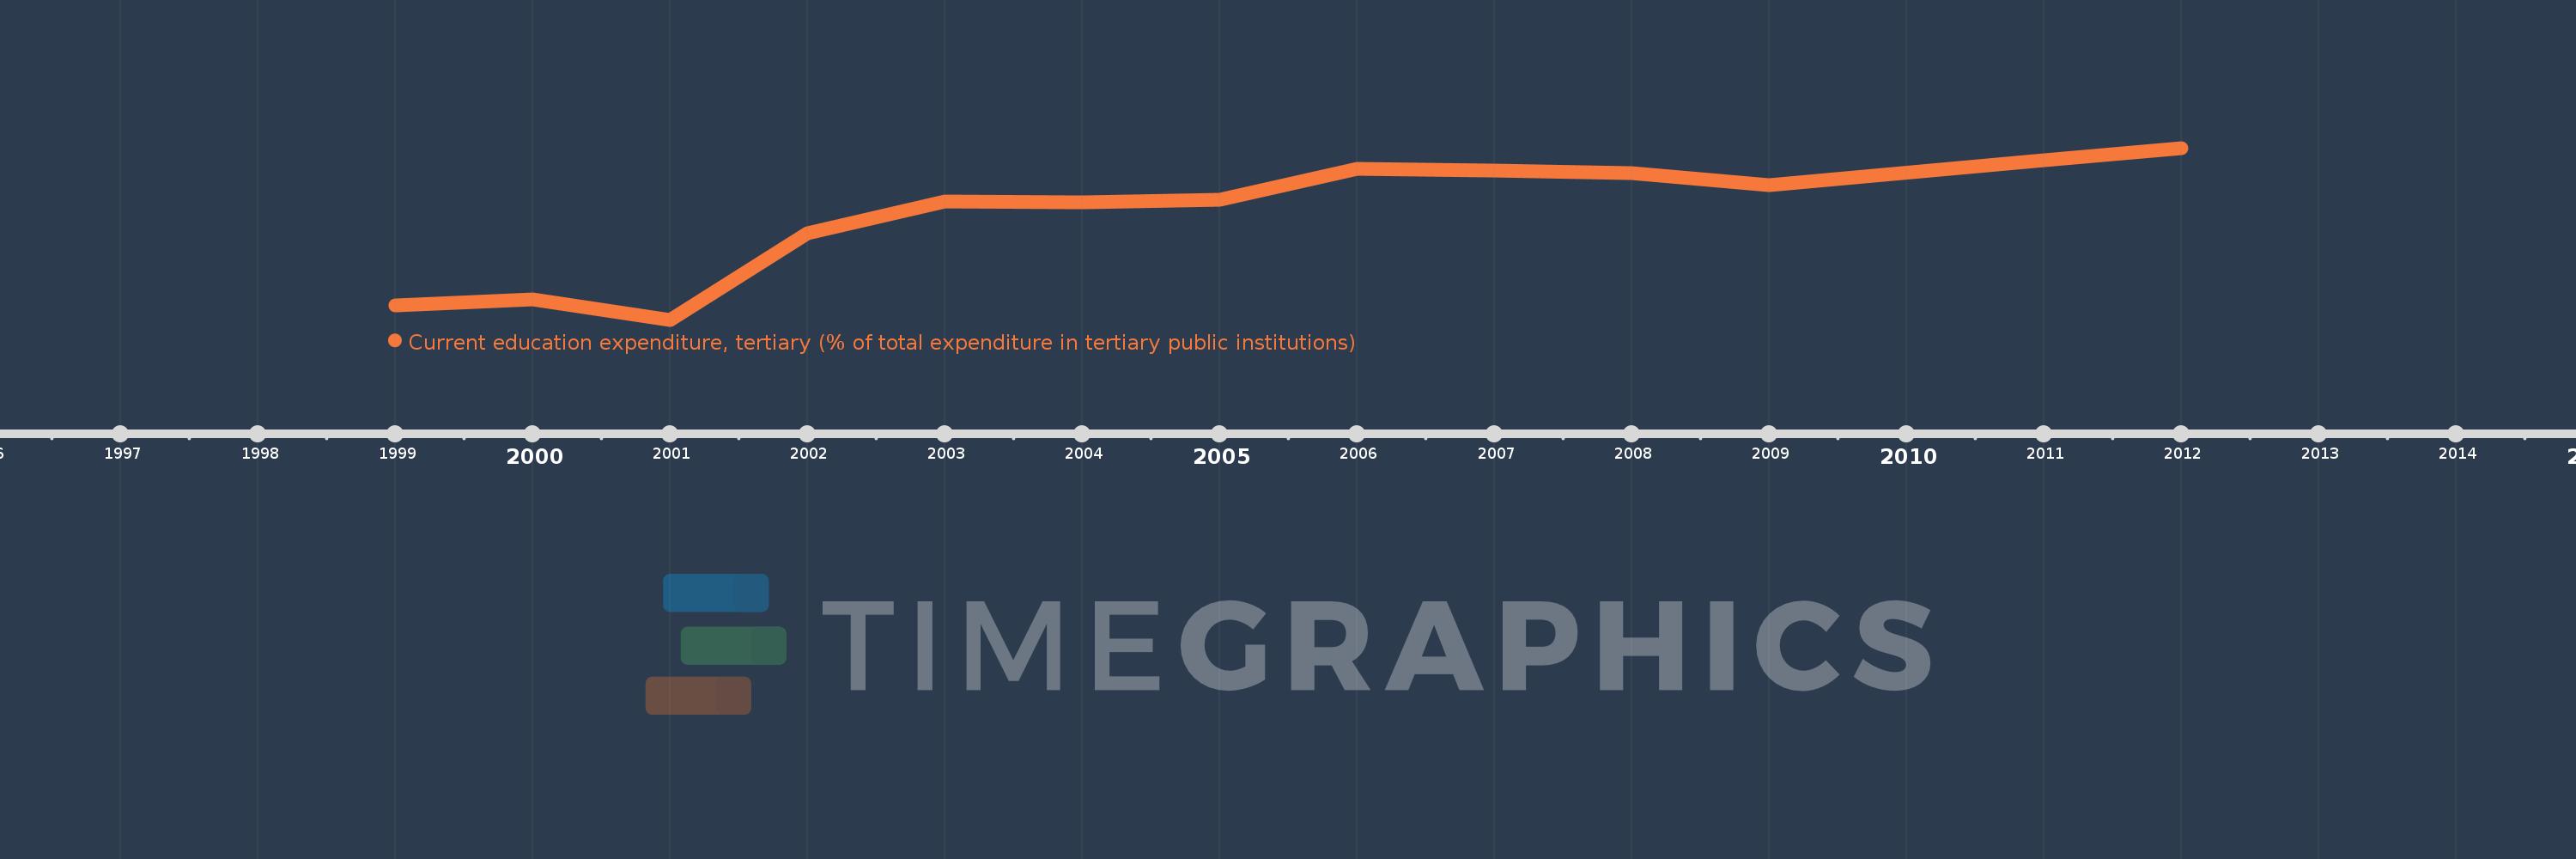
Current education expenditure, tertiary (% of total expenditure in tertiary public institutions)
2012,2011,2009,2008,2007,2006,2005,2004,2003,2002,2001,2000,1999
This statistics in other country:
Timeline:
This timeline shows a graph from 1999 to 2012 of Denmark. No data until 1998. Number of actual observations by date: 13.
Source name:
World Development Indicators
Source organization:
United Nations Educational, Scientific, and Cultural Organization (UNESCO) Institute for Statistics.
Categories, topics:
Education
Last updated:
apr 23, 2017
Indicators value changes by year
Minimum:
85.874
jan 1, 2001
Maximum:
98.104
jan 1, 2012
At the date of observation
Value
Absolute change
Change from previous value
jan 1, 1999
86.887
+86.887
0.0%
jan 1, 2000
87.299
+0.412
0.47%
jan 1, 2001
85.874
-1.425
-1.63%
jan 1, 2002
92.012
+6.138
7.15%
jan 1, 2003
94.298
+2.285
2.48%
jan 1, 2004
94.237
-0.061
-0.06%
jan 1, 2005
94.423
+0.187
0.2%
jan 1, 2006
96.627
+2.204
2.33%
jan 1, 2007
96.526
-0.1
-0.1%
jan 1, 2008
96.321
-0.205
-0.21%
jan 1, 2009
95.472
-0.849
-0.88%
jan 1, 2011
97.207
+1.735
1.82%
jan 1, 2012
98.104
+0.897
0.92%
Ranking of countries by current statistics by years


Comments: