29
/
en
AIzaSyAYiBZKx7MnpbEhh9jyipgxe19OcubqV5w
April 1, 2024
154429
India
IND
true
2
1
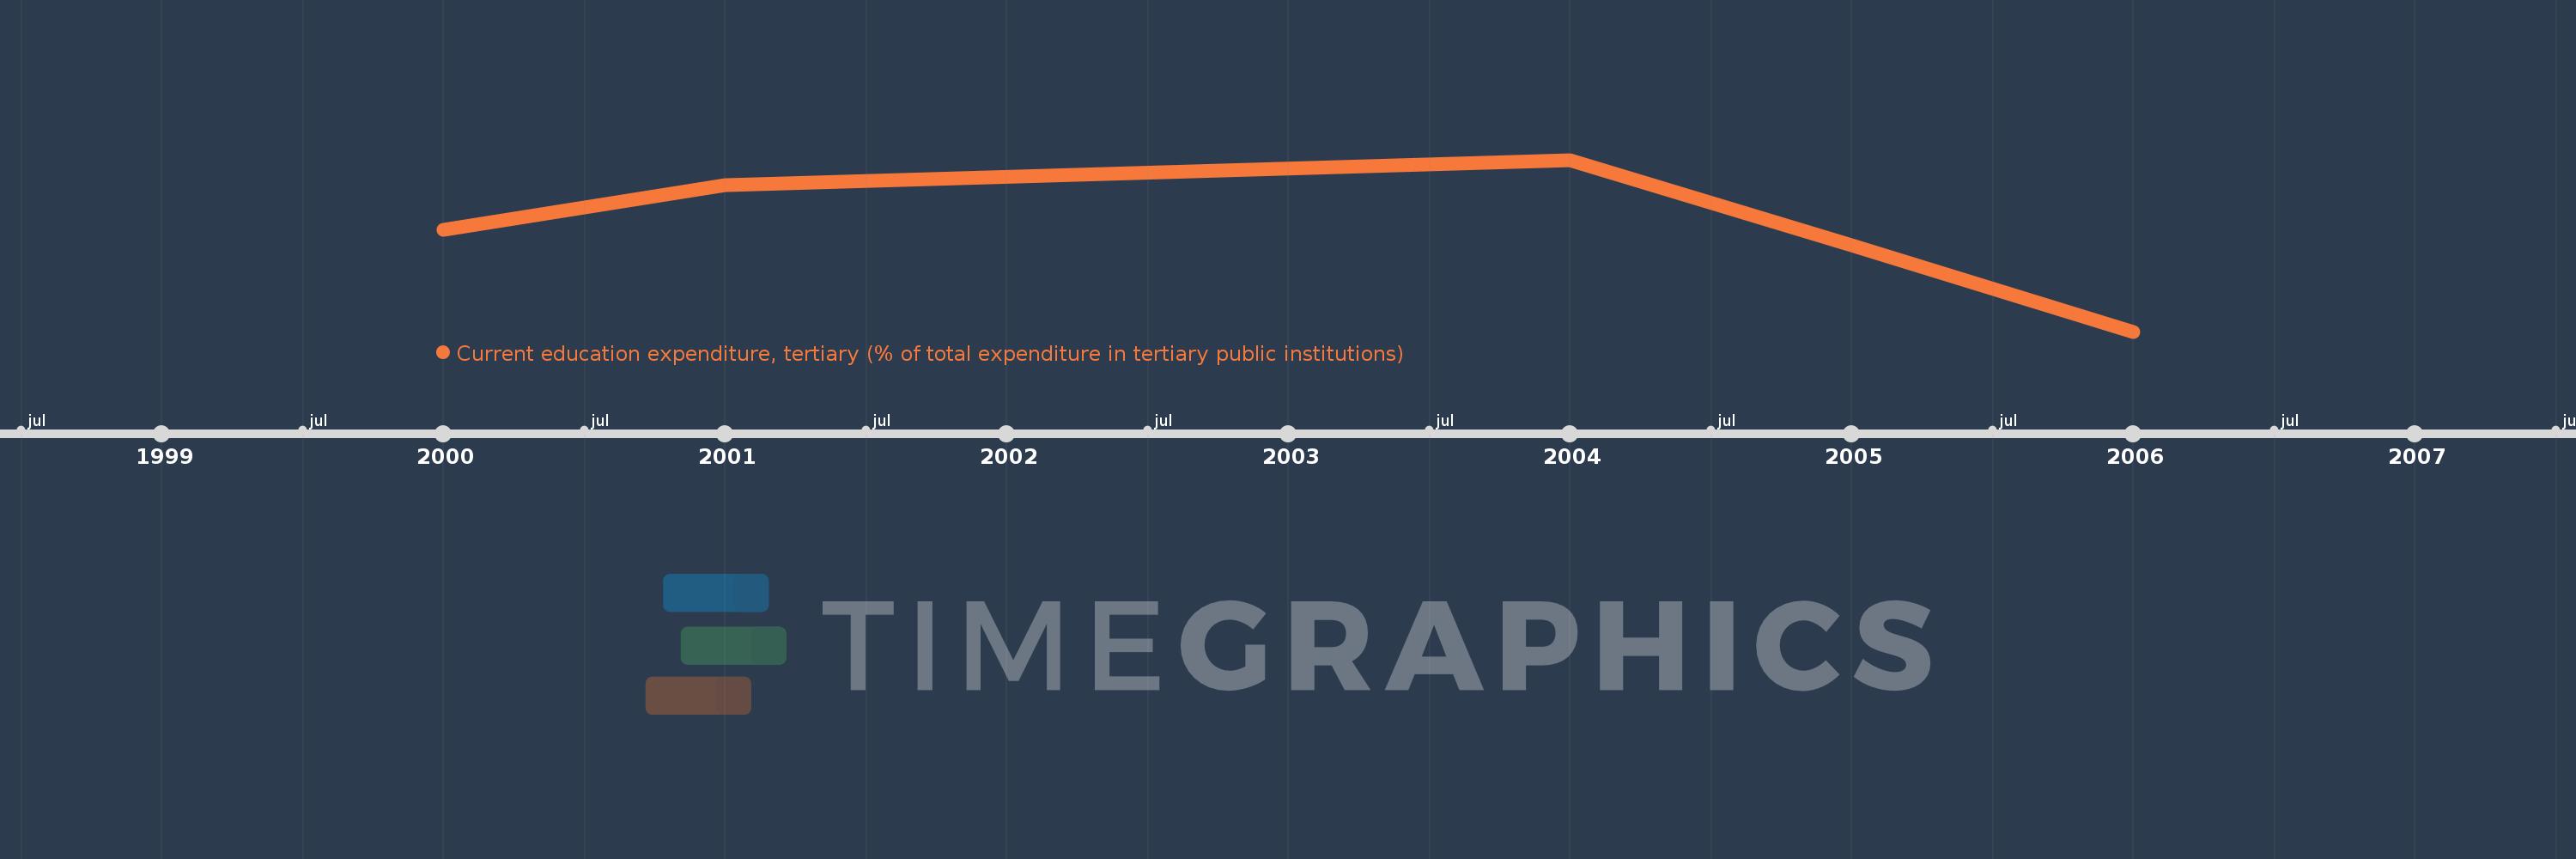
Current education expenditure, tertiary (% of total expenditure in tertiary public institutions)
2006,2005,2004,2001,2000
This statistics in other country:
Timeline:
This timeline shows a graph from 2000 to 2006 of India. No data until 1999. Number of actual observations by date: 5.
Source name:
World Development Indicators
Source organization:
United Nations Educational, Scientific, and Cultural Organization (UNESCO) Institute for Statistics.
Categories, topics:
Education
Last updated:
apr 23, 2017
Indicators value changes by year
Minimum:
97.546
jan 1, 2006
Maximum:
99.037
jan 1, 2004
At the date of observation
Value
Absolute change
Change from previous value
jan 1, 2000
98.43
+98.43
0.0%
jan 1, 2001
98.82
+0.39
0.4%
jan 1, 2004
99.037
+0.217
0.22%
jan 1, 2005
98.296
-0.741
-0.75%
jan 1, 2006
97.546
-0.751
-0.76%
Ranking of countries by current statistics by years


Comments: