29
/
en
AIzaSyAYiBZKx7MnpbEhh9jyipgxe19OcubqV5w
April 1, 2024
220640
Paraguay
PRY
true
2
1
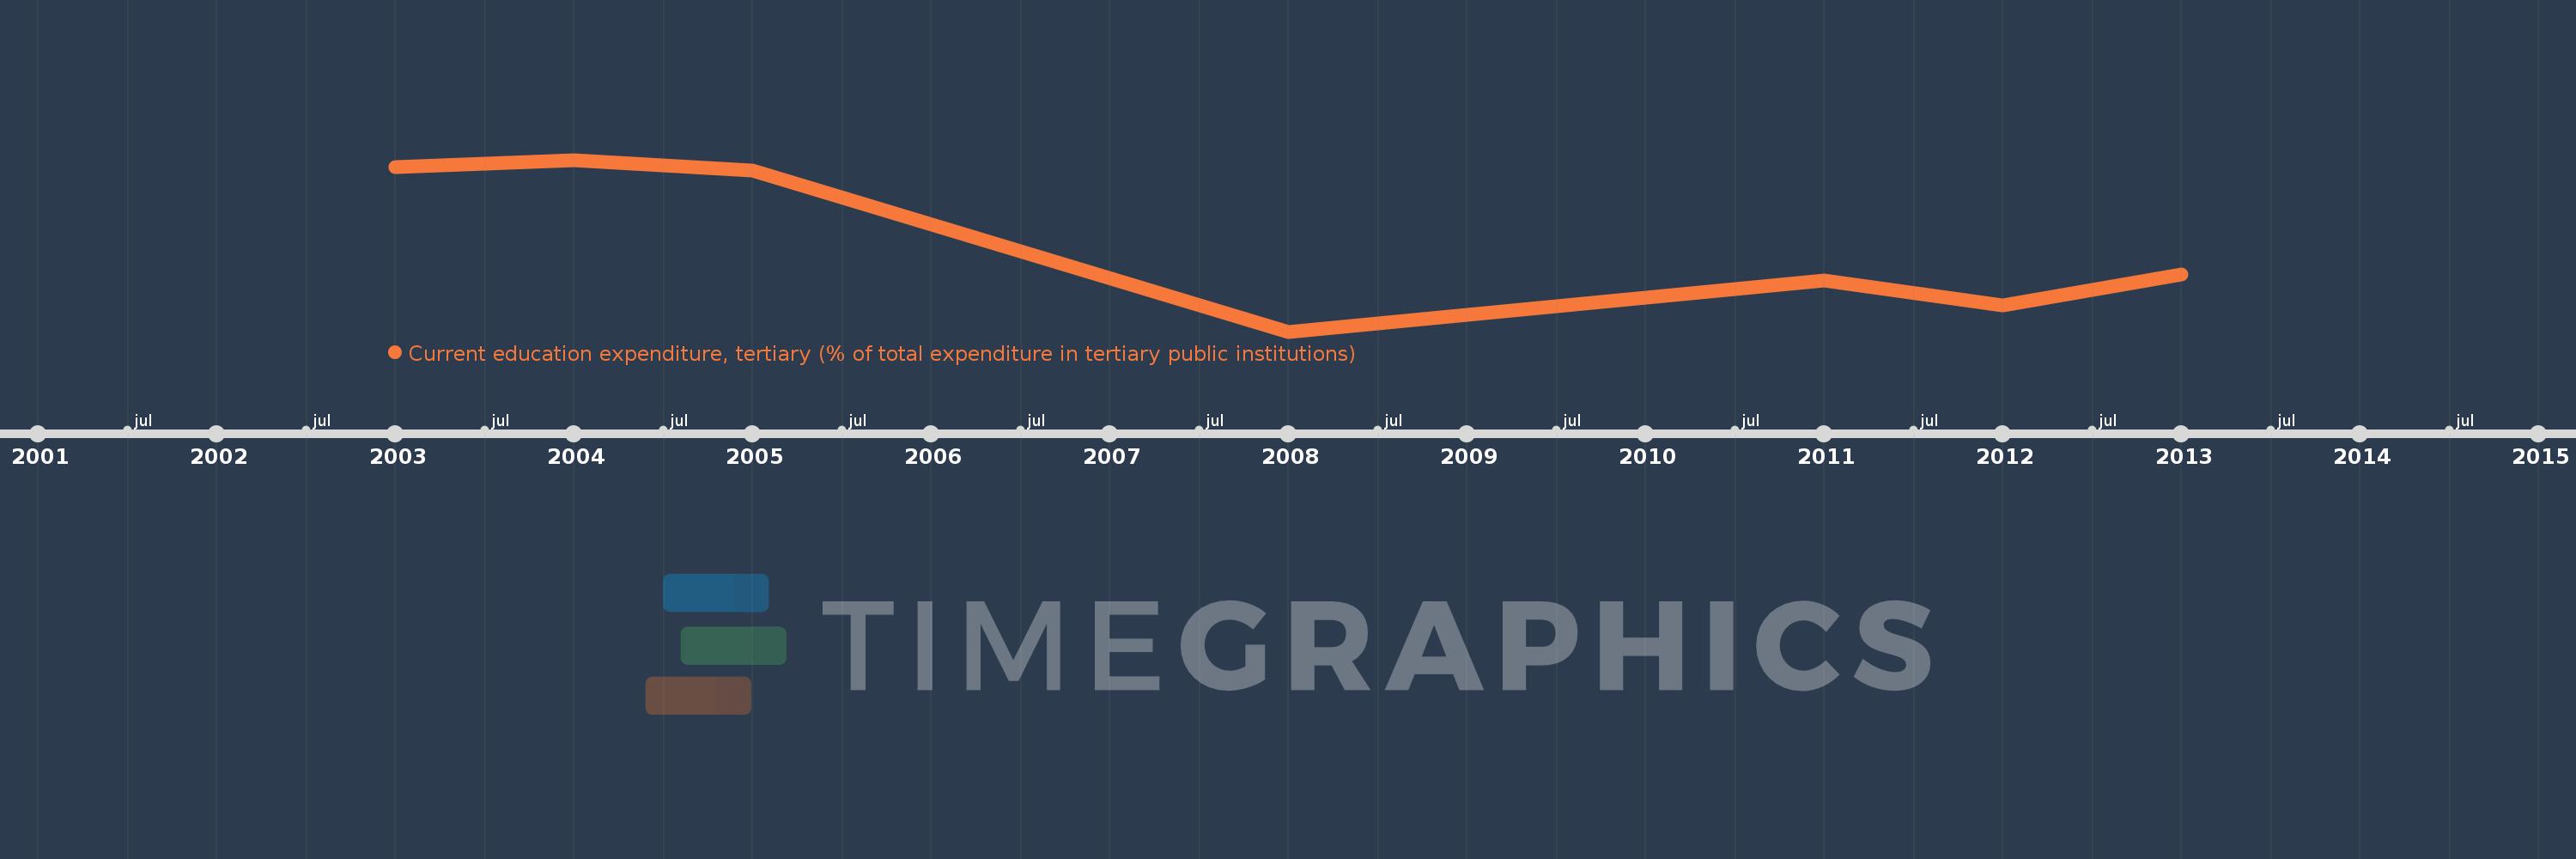
Current education expenditure, tertiary (% of total expenditure in tertiary public institutions)
2013,2012,2011,2008,2005,2004,2003
This statistics in other country:
Timeline:
This timeline shows a graph from 2003 to 2013 of Paraguay. No data until 2002. Number of actual observations by date: 7.
Source name:
World Development Indicators
Source organization:
United Nations Educational, Scientific, and Cultural Organization (UNESCO) Institute for Statistics.
Categories, topics:
Education
Last updated:
apr 23, 2017
Indicators value changes by year
Minimum:
88.193
jan 1, 2008
Maximum:
99.135
jan 1, 2004
At the date of observation
Value
Absolute change
Change from previous value
jan 1, 2003
98.682
+98.682
0.0%
jan 1, 2004
99.135
+0.453
0.46%
jan 1, 2005
98.427
-0.708
-0.71%
jan 1, 2008
88.193
-10.234
-10.4%
jan 1, 2011
91.455
+3.262
3.7%
jan 1, 2012
89.837
-1.618
-1.77%
jan 1, 2013
91.845
+2.008
2.24%
Ranking of countries by current statistics by years


Comments: