29
/
en
AIzaSyAYiBZKx7MnpbEhh9jyipgxe19OcubqV5w
April 1, 2024
160331
Israel
ISR
true
2
1
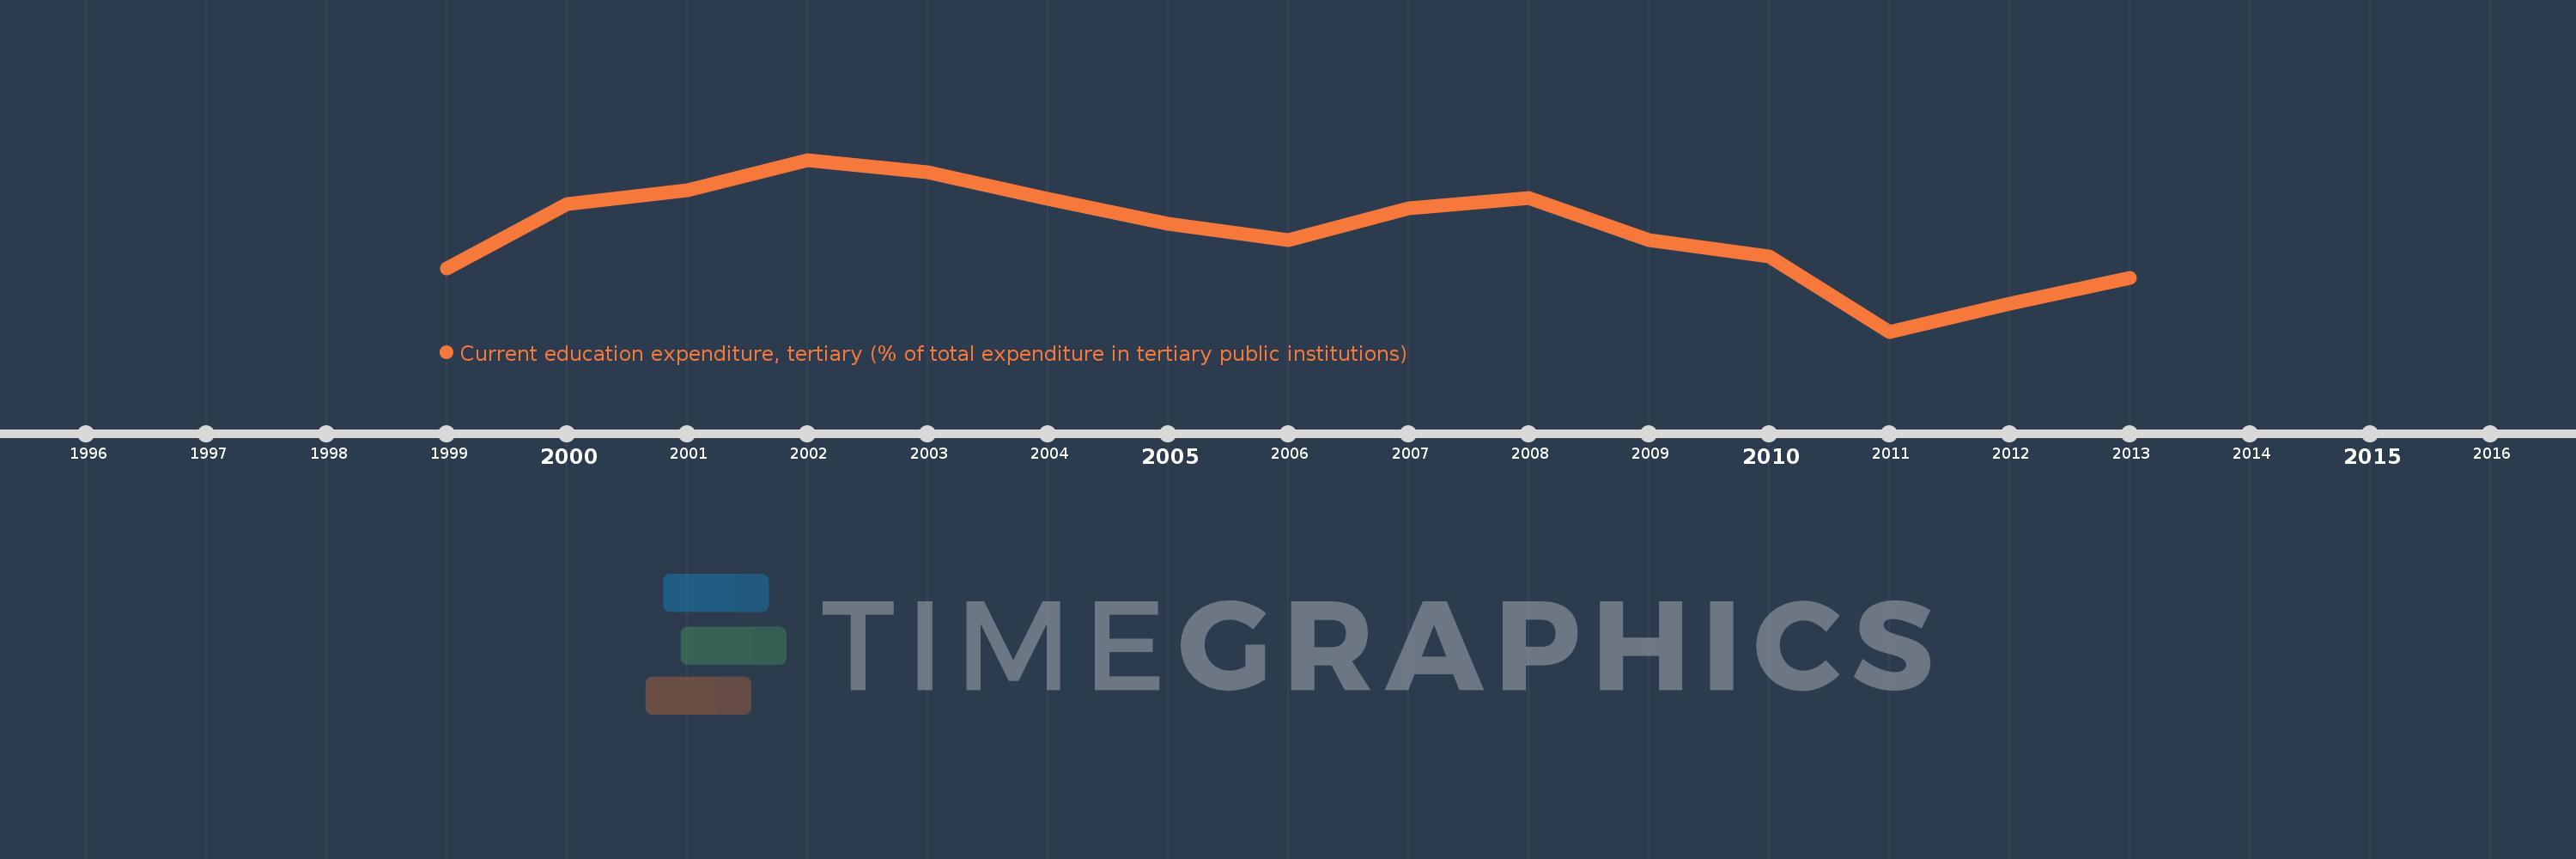
Current education expenditure, tertiary (% of total expenditure in tertiary public institutions)
2013,2012,2011,2010,2009,2008,2007,2006,2005,2004,2003,2002,2001,2000,1999
This statistics in other country:
Timeline:
This timeline shows a graph from 1999 to 2013 of Israel. No data until 1998. Number of actual observations by date: 15.
Source name:
World Development Indicators
Source organization:
United Nations Educational, Scientific, and Cultural Organization (UNESCO) Institute for Statistics.
Categories, topics:
Education
Last updated:
apr 23, 2017
Indicators value changes by year
Minimum:
81.784
jan 1, 2011
Maximum:
92.814
jan 1, 2002
At the date of observation
Value
Absolute change
Change from previous value
jan 1, 1999
85.857
+85.857
0.0%
jan 1, 2000
90.0
+4.143
4.83%
jan 1, 2001
90.842
+0.842
0.94%
jan 1, 2002
92.814
+1.973
2.17%
jan 1, 2003
92.017
-0.798
-0.86%
jan 1, 2004
90.297
-1.72
-1.87%
jan 1, 2005
88.69
-1.606
-1.78%
jan 1, 2006
87.679
-1.011
-1.14%
jan 1, 2007
89.72
+2.041
2.33%
jan 1, 2008
90.333
+0.614
0.68%
jan 1, 2009
87.667
-2.667
-2.95%
jan 1, 2010
86.622
-1.045
-1.19%
jan 1, 2011
81.784
-4.838
-5.58%
jan 1, 2012
83.601
+1.817
2.22%
jan 1, 2013
85.211
+1.61
1.93%
Ranking of countries by current statistics by years


Comments: