29
/
en
AIzaSyAYiBZKx7MnpbEhh9jyipgxe19OcubqV5w
April 1, 2024
172650
Kyrgyz Republic
KGZ
true
2
1
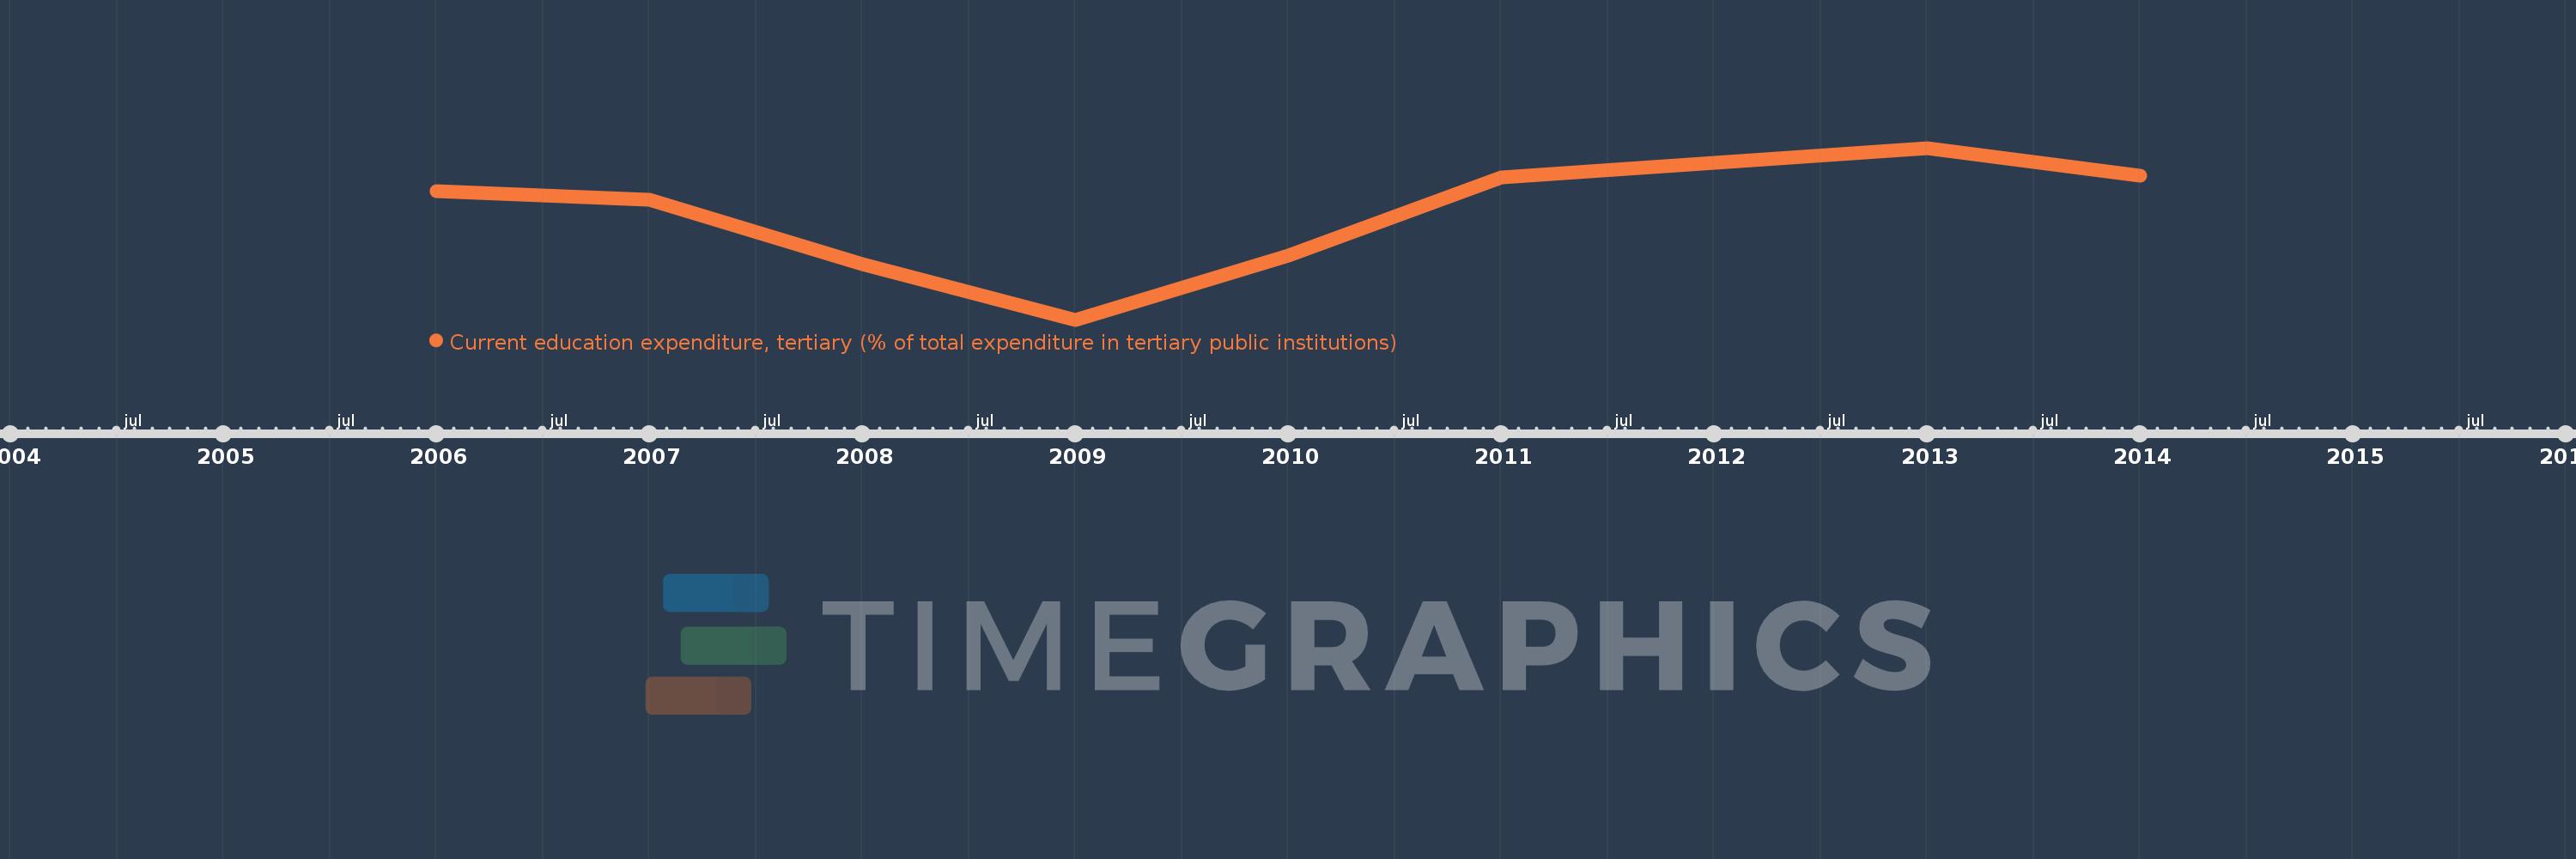
Current education expenditure, tertiary (% of total expenditure in tertiary public institutions)
2014,2013,2011,2010,2009,2008,2007,2006
This statistics in other country:
Timeline:
This timeline shows a graph from 2006 to 2014 of Kyrgyz Republic. No data until 2005. Number of actual observations by date: 8.
Source name:
World Development Indicators
Source organization:
United Nations Educational, Scientific, and Cultural Organization (UNESCO) Institute for Statistics.
Categories, topics:
Education
Last updated:
apr 23, 2017
Indicators value changes by year
Minimum:
86.692
jan 1, 2009
Maximum:
95.263
jan 1, 2013
At the date of observation
Value
Absolute change
Change from previous value
jan 1, 2006
93.119
+93.119
0.0%
jan 1, 2007
92.695
-0.424
-0.46%
jan 1, 2008
89.465
-3.23
-3.48%
jan 1, 2009
86.692
-2.773
-3.1%
jan 1, 2010
89.91
+3.218
3.71%
jan 1, 2011
93.775
+3.864
4.3%
jan 1, 2013
95.263
+1.489
1.59%
jan 1, 2014
93.876
-1.387
-1.46%
Ranking of countries by current statistics by years


Comments: