29
/
en
AIzaSyAYiBZKx7MnpbEhh9jyipgxe19OcubqV5w
April 1, 2024
133953
France
FRA
true
2
1
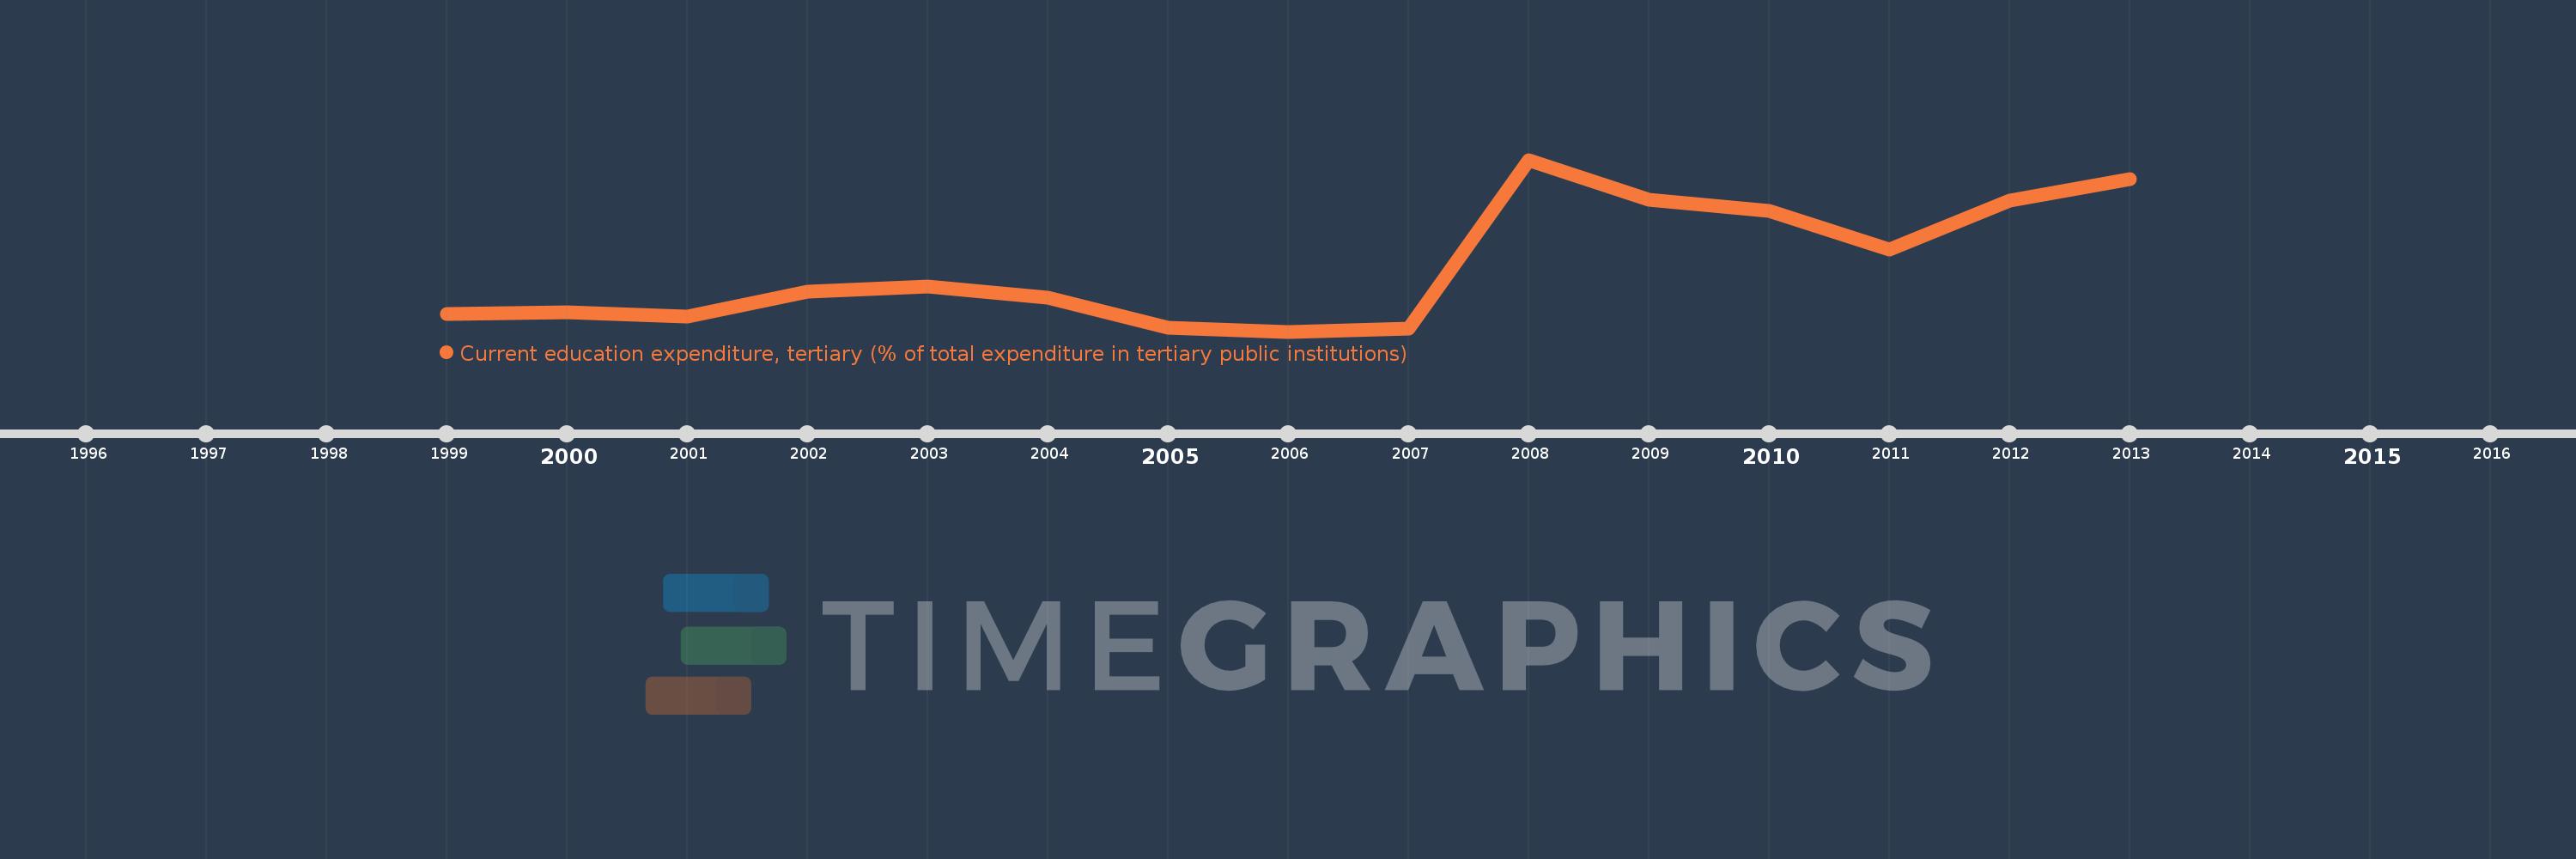
Current education expenditure, tertiary (% of total expenditure in tertiary public institutions)
2013,2012,2011,2010,2009,2008,2007,2006,2005,2004,2003,2002,2001,2000,1999
This statistics in other country:
Timeline:
This timeline shows a graph from 1999 to 2013 of France. No data until 1998. Number of actual observations by date: 15.
Source name:
World Development Indicators
Source organization:
United Nations Educational, Scientific, and Cultural Organization (UNESCO) Institute for Statistics.
Categories, topics:
Education
Last updated:
apr 23, 2017
Indicators value changes by year
Minimum:
88.151
jan 1, 2006
Maximum:
92.318
jan 1, 2008
At the date of observation
Value
Absolute change
Change from previous value
jan 1, 1999
88.583
+88.583
0.0%
jan 1, 2000
88.611
+0.028
0.03%
jan 1, 2001
88.507
-0.103
-0.12%
jan 1, 2002
89.112
+0.604
0.68%
jan 1, 2003
89.251
+0.139
0.16%
jan 1, 2004
88.981
-0.27
-0.3%
jan 1, 2005
88.25
-0.731
-0.82%
jan 1, 2006
88.151
-0.099
-0.11%
jan 1, 2007
88.229
+0.078
0.09%
jan 1, 2008
92.318
+4.089
4.63%
jan 1, 2009
91.356
-0.961
-1.04%
jan 1, 2010
91.076
-0.28
-0.31%
jan 1, 2011
90.143
-0.933
-1.02%
jan 1, 2012
91.338
+1.195
1.33%
jan 1, 2013
91.858
+0.52
0.57%
Ranking of countries by current statistics by years


Comments: