29
/
en
AIzaSyAYiBZKx7MnpbEhh9jyipgxe19OcubqV5w
April 1, 2024
230873
Rwanda
RWA
true
2
1
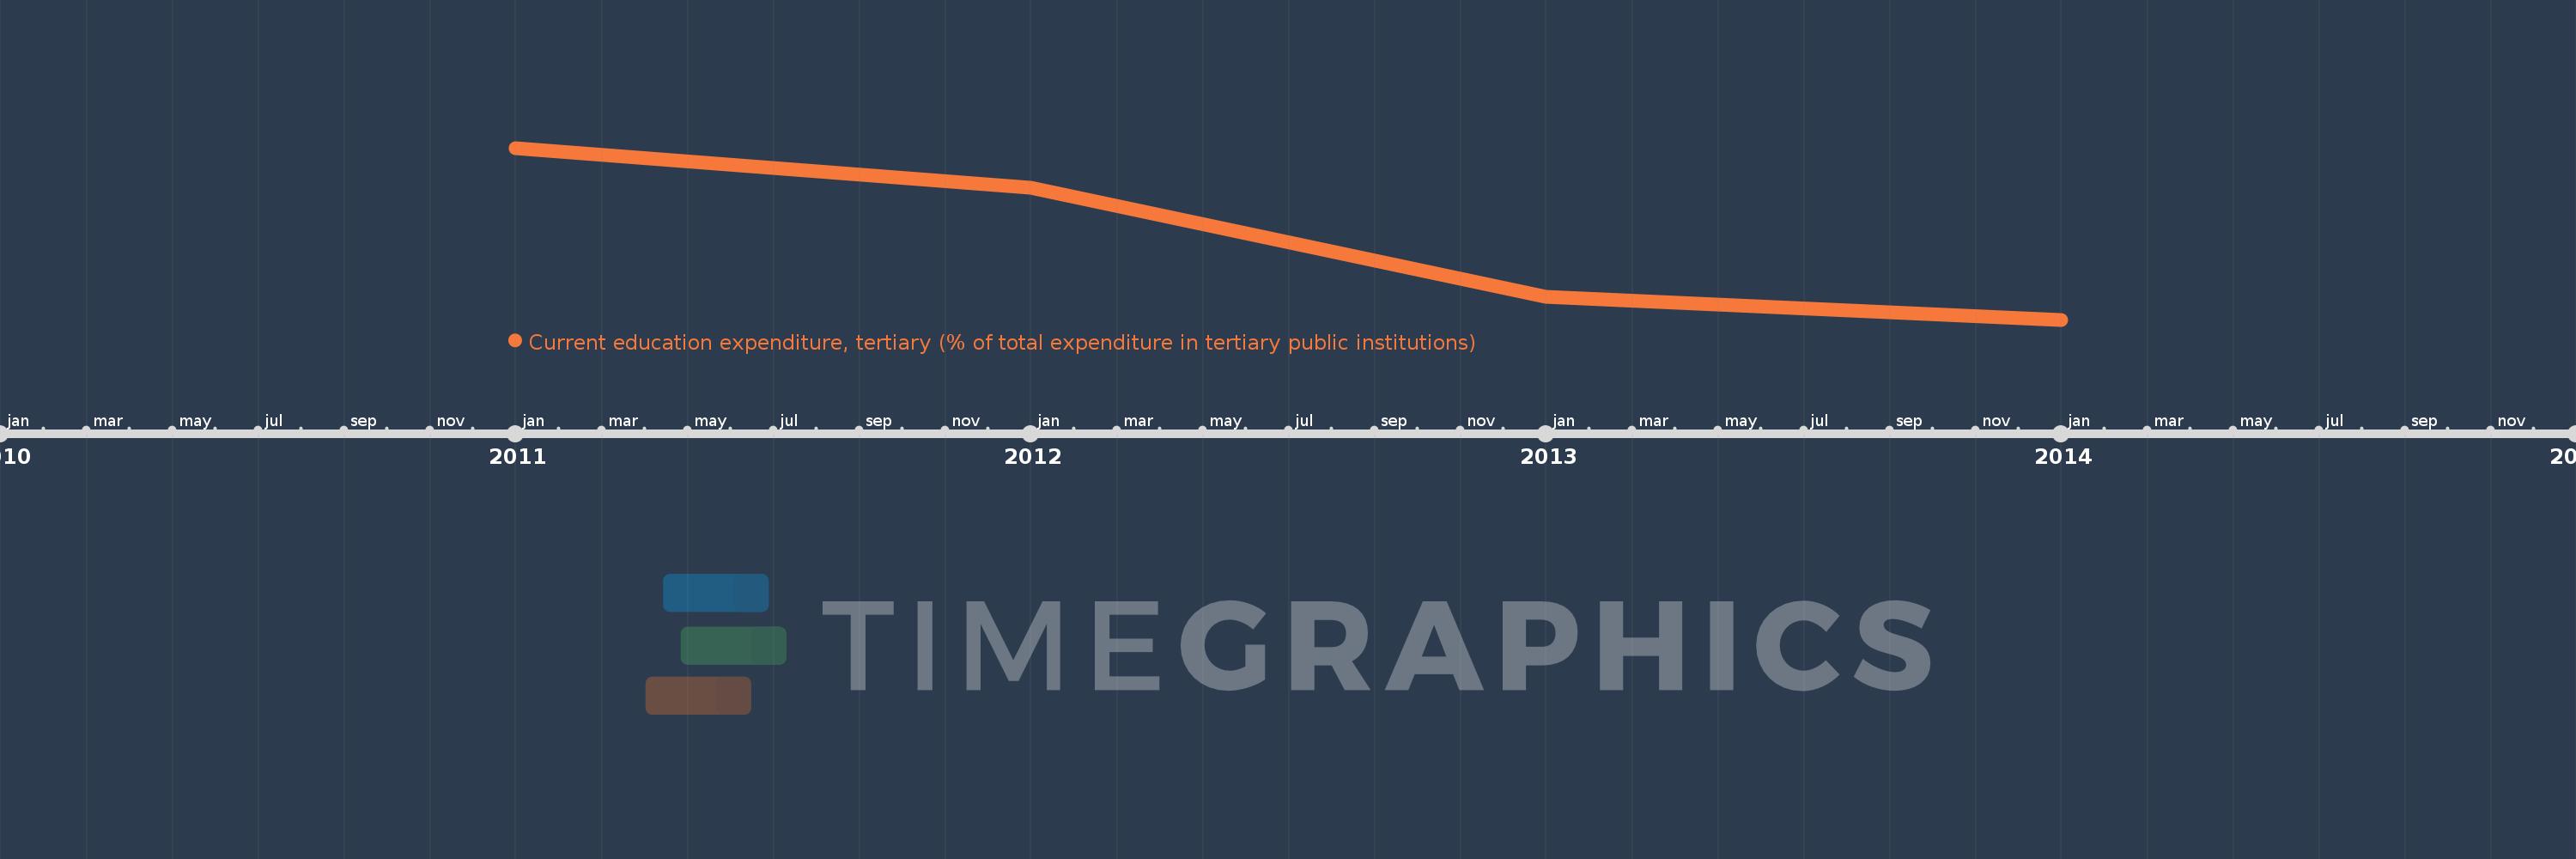
Current education expenditure, tertiary (% of total expenditure in tertiary public institutions)
2014,2013,2012,2011
This statistics in other country:
Timeline:
This timeline shows a graph from 2011 to 2014 of Rwanda. No data until 2010. Number of actual observations by date: 4.
Source name:
World Development Indicators
Source organization:
United Nations Educational, Scientific, and Cultural Organization (UNESCO) Institute for Statistics.
Categories, topics:
Education
Last updated:
apr 23, 2017
Indicators value changes by year
Minimum:
82.221
jan 1, 2014
Maximum:
93.404
jan 1, 2011
At the date of observation
Value
Absolute change
Change from previous value
jan 1, 2011
93.404
+93.404
0.0%
jan 1, 2012
90.808
-2.596
-2.78%
jan 1, 2013
83.711
-7.097
-7.82%
jan 1, 2014
82.221
-1.489
-1.78%
Ranking of countries by current statistics by years


Comments: