29
/
en
AIzaSyAYiBZKx7MnpbEhh9jyipgxe19OcubqV5w
April 1, 2024
197357
Moldova
MDA
true
2
1
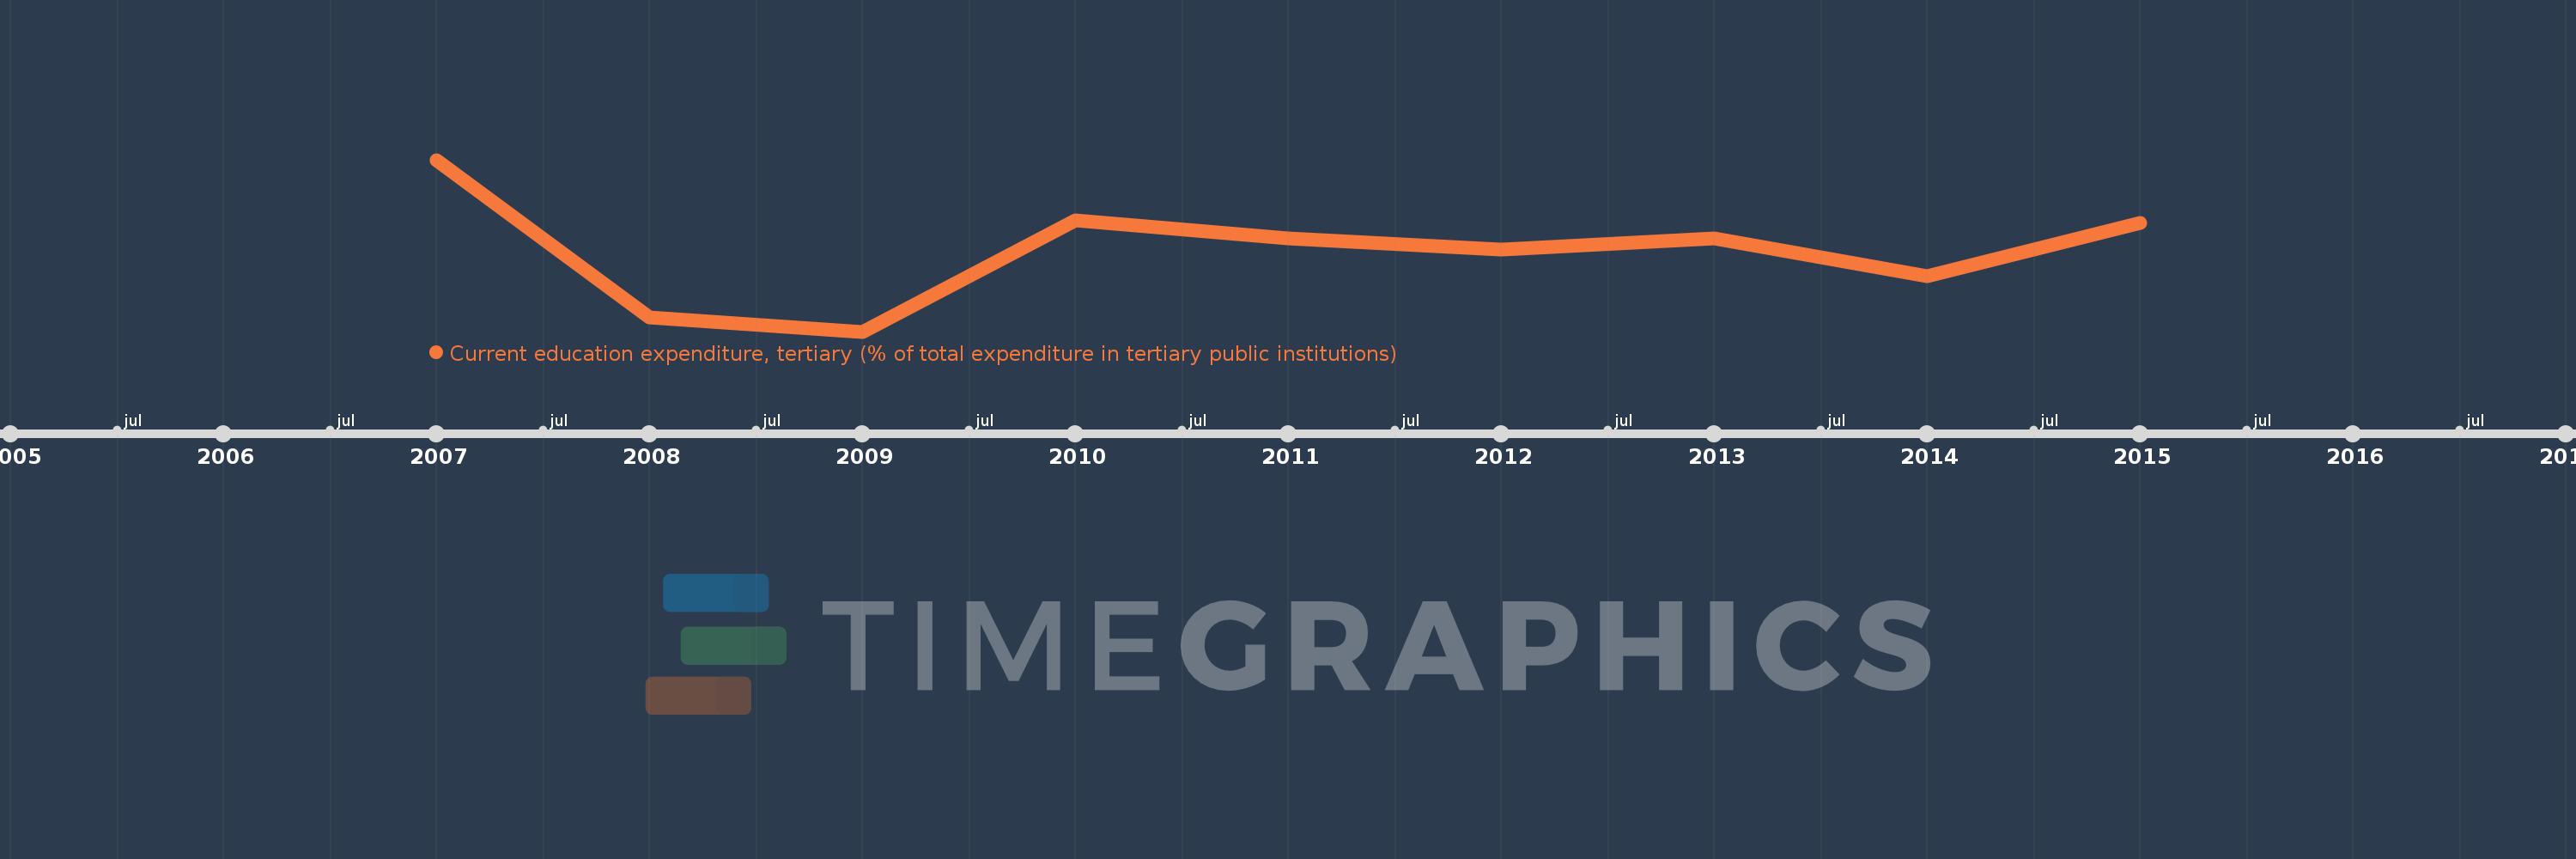
Current education expenditure, tertiary (% of total expenditure in tertiary public institutions)
2015,2014,2013,2012,2011,2010,2009,2008,2007
This statistics in other country:
Timeline:
This timeline shows a graph from 2007 to 2015 of Moldova. No data until 2006. Number of actual observations by date: 9.
Source name:
World Development Indicators
Source organization:
United Nations Educational, Scientific, and Cultural Organization (UNESCO) Institute for Statistics.
Categories, topics:
Education
Last updated:
apr 23, 2017
Indicators value changes by year
Minimum:
86.109
jan 1, 2009
At the date of observation
Value
Absolute change
Change from previous value
jan 1, 2007
100.0
+100.0
0.0%
jan 1, 2008
87.263
-12.737
-12.74%
jan 1, 2009
86.109
-1.155
-1.32%
jan 1, 2010
95.135
+9.026
10.48%
jan 1, 2011
93.678
-1.456
-1.53%
jan 1, 2012
92.735
-0.943
-1.01%
jan 1, 2013
93.665
+0.93
1.0%
jan 1, 2014
90.598
-3.068
-3.28%
jan 1, 2015
94.862
+4.265
4.71%
Ranking of countries by current statistics by years


Comments: