29
/
en
AIzaSyAYiBZKx7MnpbEhh9jyipgxe19OcubqV5w
April 1, 2024
236904
Serbia
SRB
true
2
1
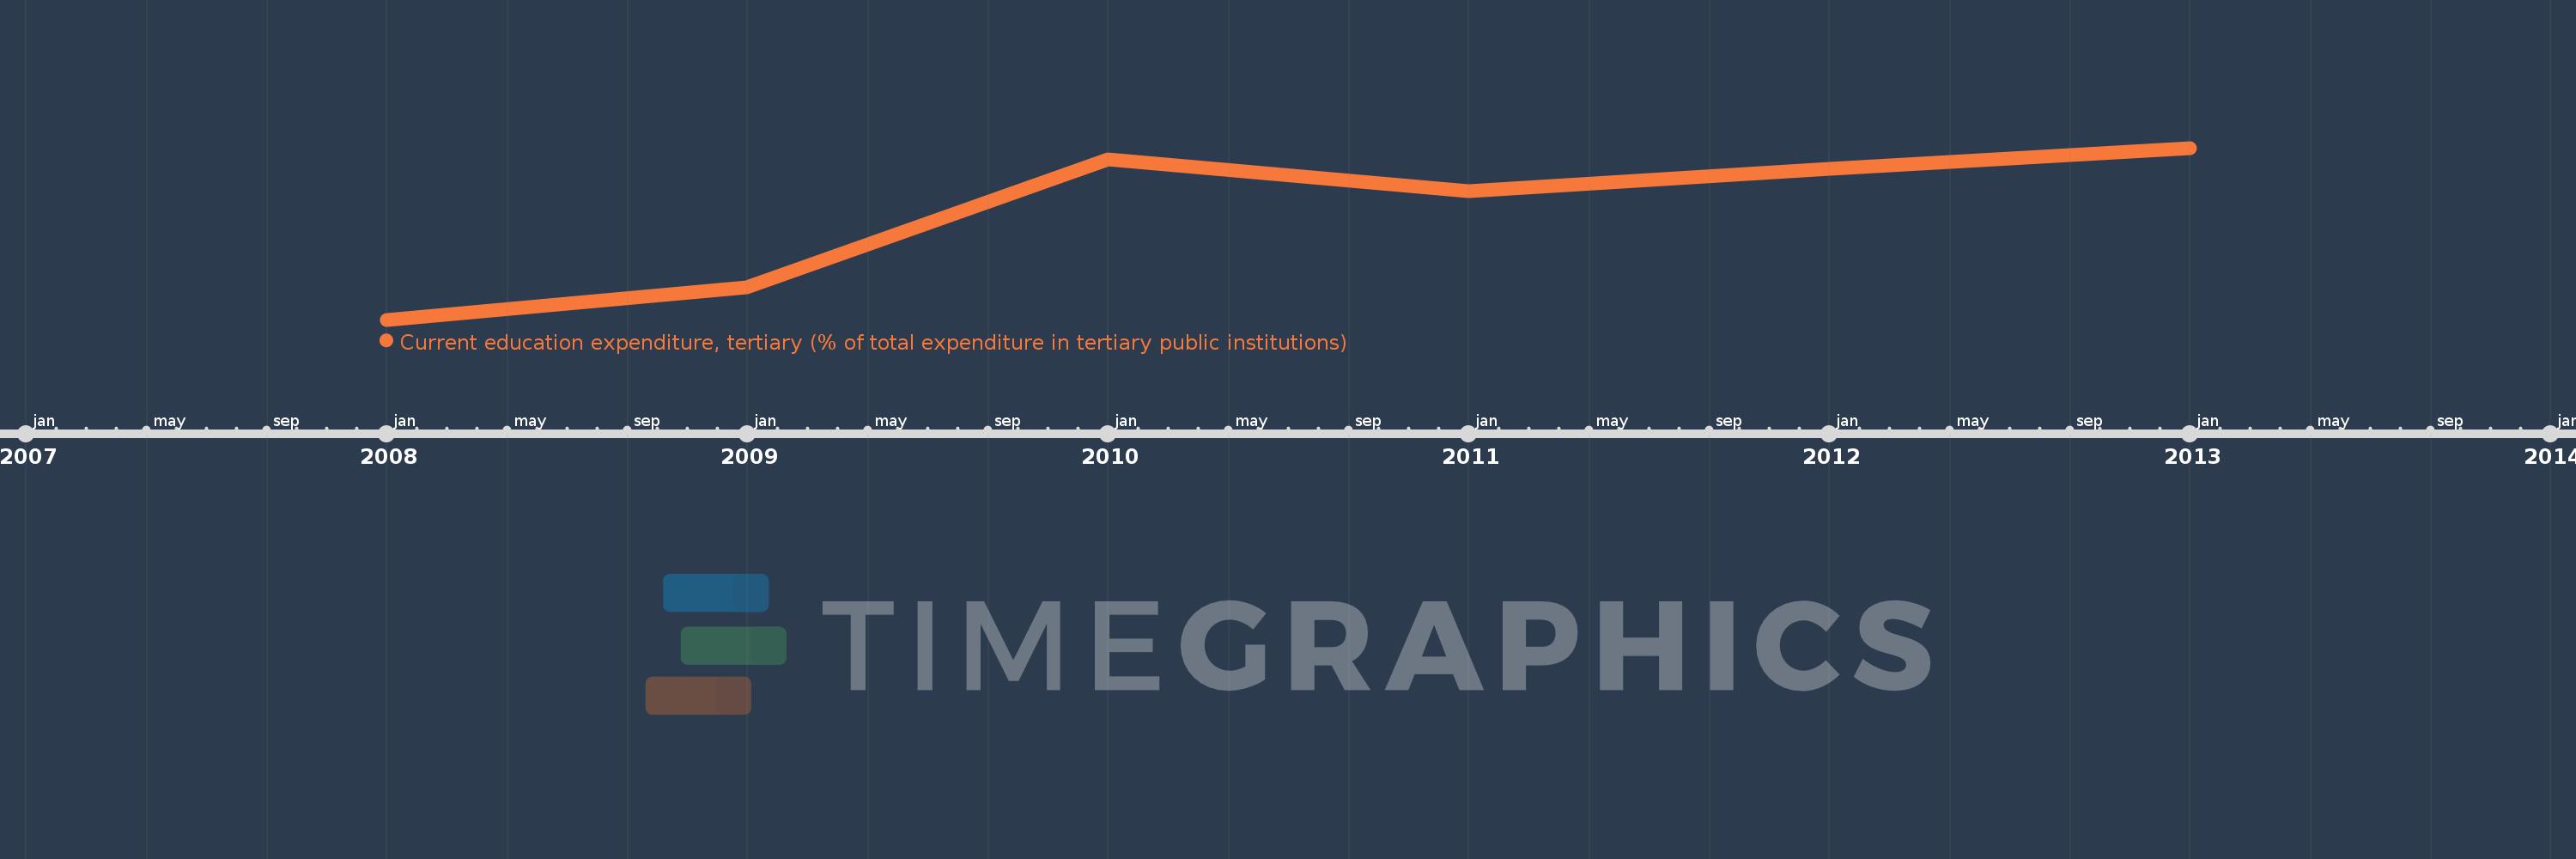
Current education expenditure, tertiary (% of total expenditure in tertiary public institutions)
2013,2012,2011,2010,2009,2008
This statistics in other country:
Timeline:
This timeline shows a graph from 2008 to 2013 of Serbia. No data until 2007. Number of actual observations by date: 6.
Source name:
World Development Indicators
Source organization:
United Nations Educational, Scientific, and Cultural Organization (UNESCO) Institute for Statistics.
Categories, topics:
Education
Last updated:
apr 23, 2017
Indicators value changes by year
Minimum:
94.341
jan 1, 2008
Maximum:
96.708
jan 1, 2013
At the date of observation
Value
Absolute change
Change from previous value
jan 1, 2008
94.341
+94.341
0.0%
jan 1, 2009
94.786
+0.445
0.47%
jan 1, 2010
96.553
+1.766
1.86%
jan 1, 2011
96.116
-0.436
-0.45%
jan 1, 2012
96.415
+0.299
0.31%
jan 1, 2013
96.708
+0.292
0.3%
Ranking of countries by current statistics by years


Comments: