29
/
en
AIzaSyAYiBZKx7MnpbEhh9jyipgxe19OcubqV5w
April 1, 2024
165968
Kazakhstan
KAZ
true
2
1
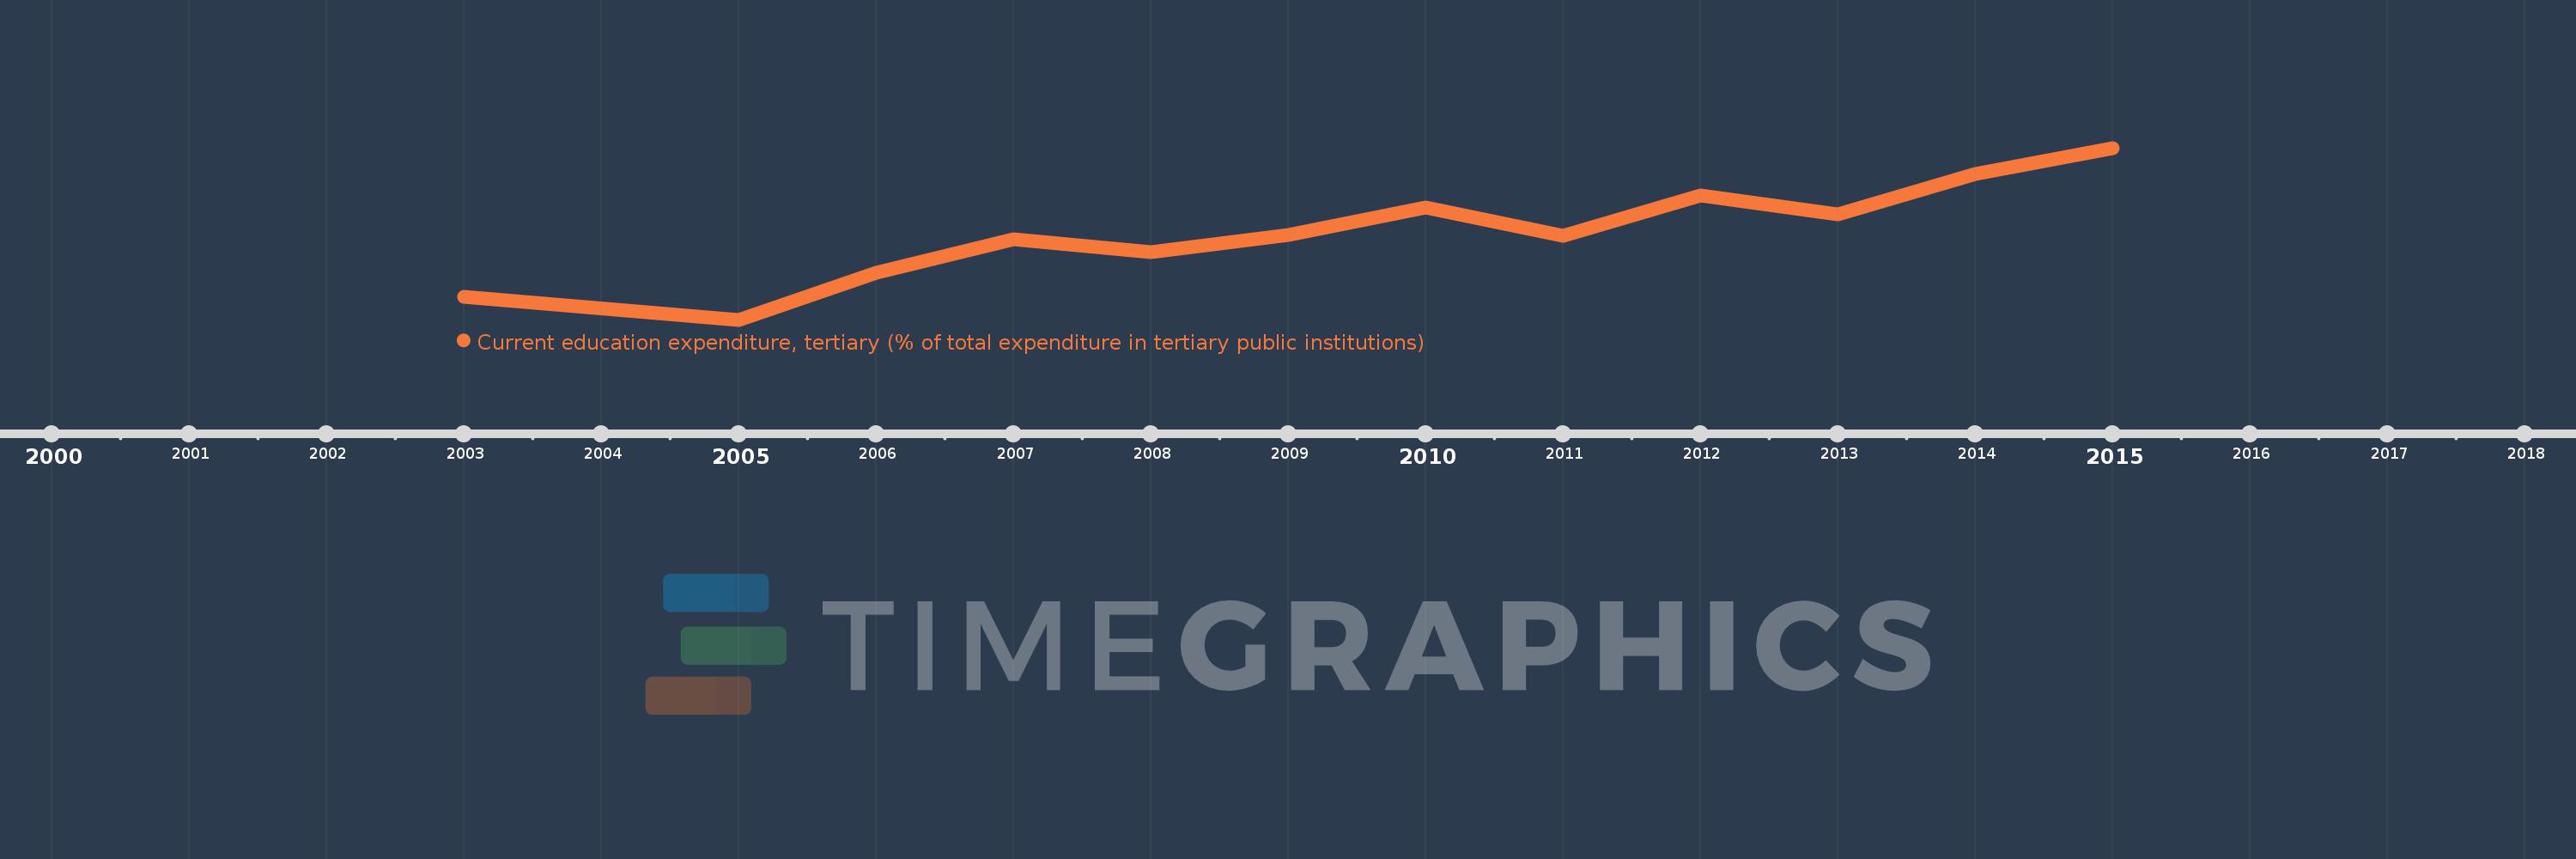
Current education expenditure, tertiary (% of total expenditure in tertiary public institutions)
2015,2014,2013,2012,2011,2010,2009,2008,2007,2006,2005,2003
This statistics in other country:
Timeline:
This timeline shows a graph from 2003 to 2015 of Kazakhstan. No data until 2002. Number of actual observations by date: 12.
Source name:
World Development Indicators
Source organization:
United Nations Educational, Scientific, and Cultural Organization (UNESCO) Institute for Statistics.
Categories, topics:
Education
Last updated:
apr 23, 2017
Indicators value changes by year
Minimum:
77.459
jan 1, 2005
At the date of observation
Value
Absolute change
Change from previous value
jan 1, 2003
79.906
+79.906
0.0%
jan 1, 2005
77.459
-2.446
-3.06%
jan 1, 2006
82.461
+5.002
6.46%
jan 1, 2007
85.978
+3.517
4.26%
jan 1, 2008
84.603
-1.375
-1.6%
jan 1, 2009
86.513
+1.91
2.26%
jan 1, 2010
89.394
+2.881
3.33%
jan 1, 2011
86.361
-3.034
-3.39%
jan 1, 2012
90.694
+4.333
5.02%
jan 1, 2013
88.708
-1.986
-2.19%
jan 1, 2014
92.953
+4.245
4.79%
jan 1, 2015
95.73
+2.776
2.99%
Ranking of countries by current statistics by years


Comments: