29
/
en
AIzaSyAYiBZKx7MnpbEhh9jyipgxe19OcubqV5w
April 1, 2024
67100
Andorra
AND
true
2
1
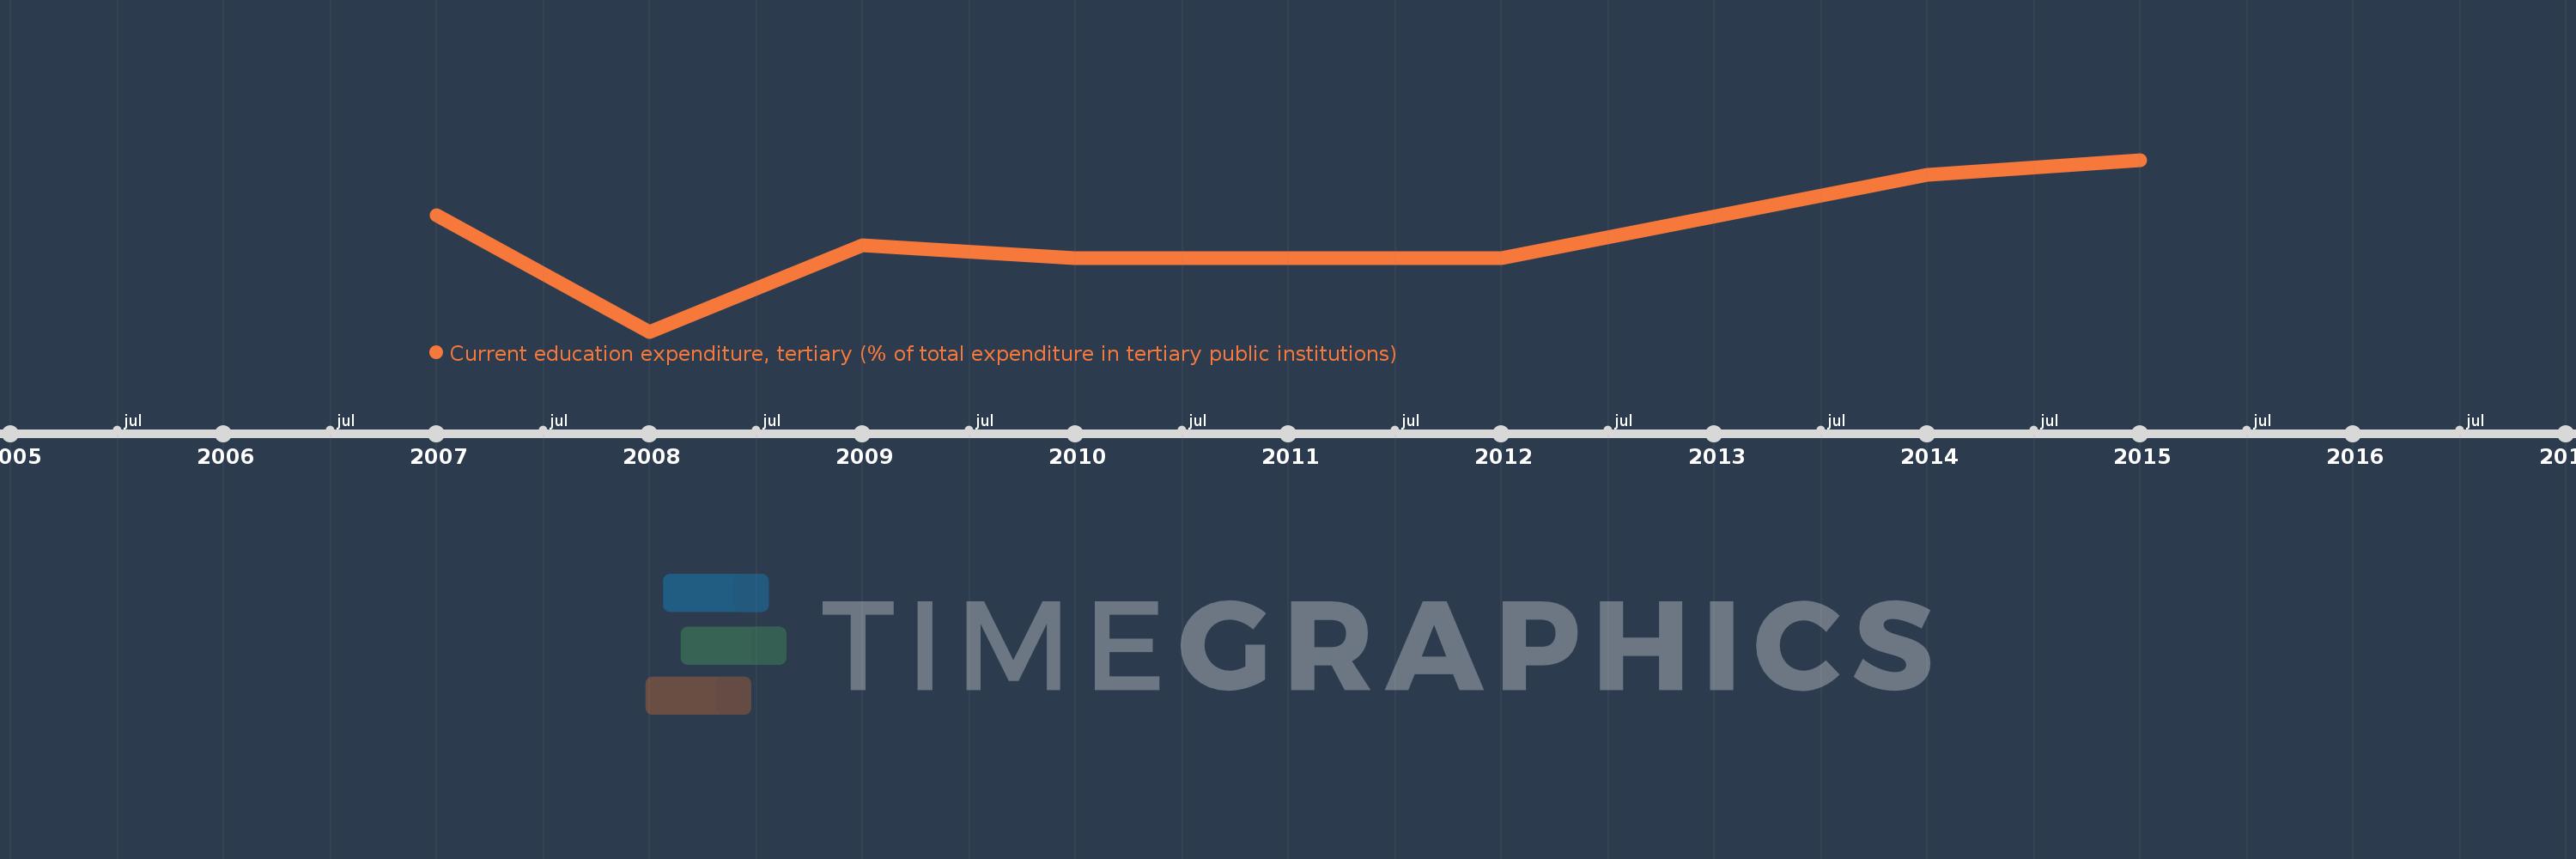
Current education expenditure, tertiary (% of total expenditure in tertiary public institutions)
2015,2014,2012,2011,2010,2009,2008,2007
This statistics in other country:
Timeline:
This timeline shows a graph from 2007 to 2015 of Andorra. No data until 2006. Number of actual observations by date: 8.
Source name:
World Development Indicators
Source organization:
United Nations Educational, Scientific, and Cultural Organization (UNESCO) Institute for Statistics.
Categories, topics:
Education
Last updated:
apr 23, 2017
Indicators value changes by year
Minimum:
90.844
jan 1, 2008
Maximum:
99.473
jan 1, 2015
At the date of observation
Value
Absolute change
Change from previous value
jan 1, 2007
96.696
+96.696
0.0%
jan 1, 2008
90.844
-5.852
-6.05%
jan 1, 2009
95.161
+4.317
4.75%
jan 1, 2010
94.55
-0.611
-0.64%
jan 1, 2011
94.55
0.0
0.0%
jan 1, 2012
94.55
0.0
0.0%
jan 1, 2014
98.72
+4.17
4.41%
jan 1, 2015
99.473
+0.752
0.76%
Ranking of countries by current statistics by years


Comments: