29
/
en
AIzaSyAYiBZKx7MnpbEhh9jyipgxe19OcubqV5w
April 1, 2024
54674
Post-demographic dividend
PST
false
2
1
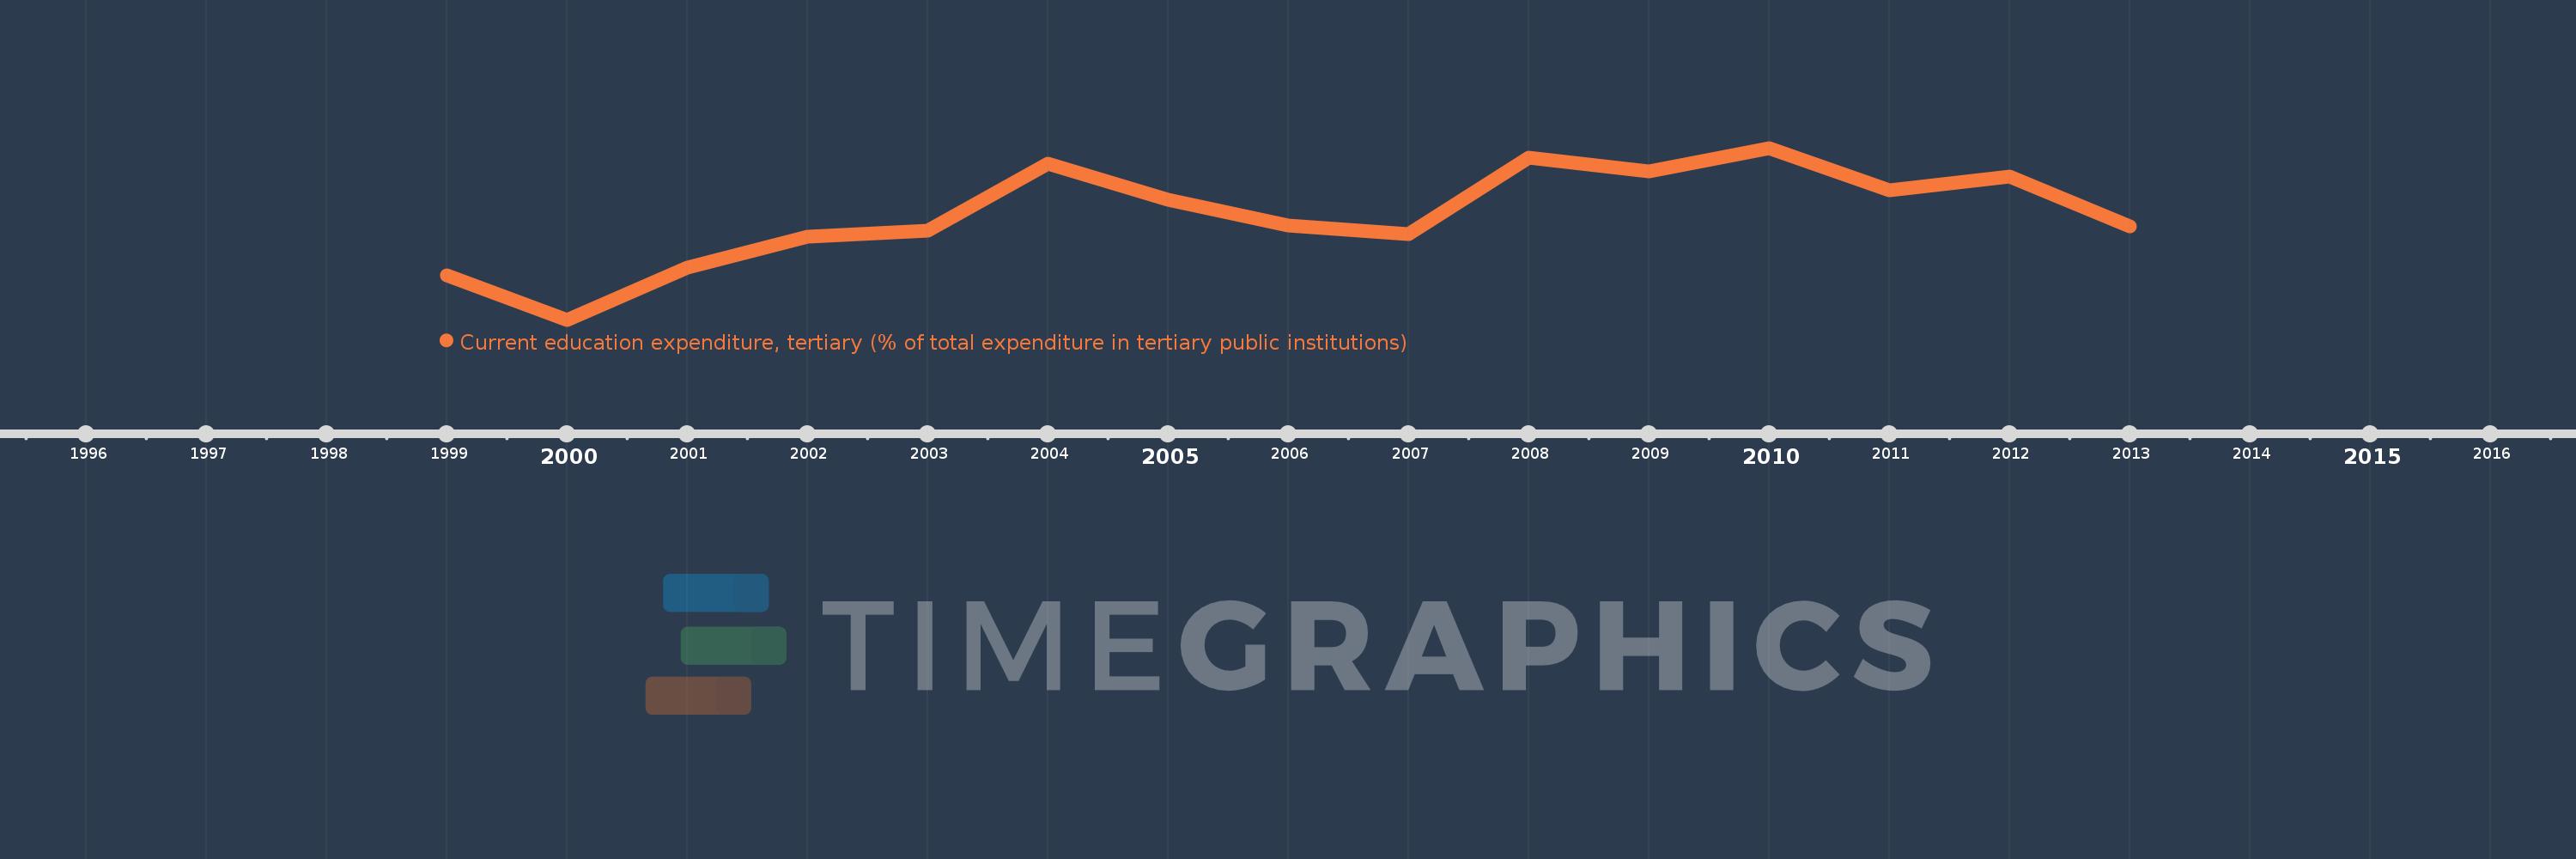
Current education expenditure, tertiary (% of total expenditure in tertiary public institutions)
2013,2012,2011,2010,2009,2008,2007,2006,2005,2004,2003,2002,2001,2000,1999
This statistics in other country:
Timeline:
This timeline shows a graph from 1999 to 2013 of Post-demographic dividend. No data until 1998. Number of actual observations by date: 15.
Source name:
World Development Indicators
Source organization:
United Nations Educational, Scientific, and Cultural Organization (UNESCO) Institute for Statistics.
Categories, topics:
Education
Last updated:
apr 23, 2017
Indicators value changes by year
Minimum:
87.299
jan 1, 2000
Maximum:
91.052
jan 1, 2010
At the date of observation
Value
Absolute change
Change from previous value
jan 1, 1999
88.275
+88.275
0.0%
jan 1, 2000
87.299
-0.976
-1.11%
jan 1, 2001
88.445
+1.145
1.31%
jan 1, 2002
89.112
+0.667
0.75%
jan 1, 2003
89.251
+0.139
0.16%
jan 1, 2004
90.716
+1.465
1.64%
jan 1, 2005
89.922
-0.794
-0.87%
jan 1, 2006
89.356
-0.567
-0.63%
jan 1, 2007
89.172
-0.183
-0.21%
jan 1, 2008
90.832
+1.659
1.86%
jan 1, 2009
90.538
-0.293
-0.32%
jan 1, 2010
91.052
+0.514
0.57%
jan 1, 2011
90.121
-0.931
-1.02%
jan 1, 2012
90.422
+0.301
0.33%
jan 1, 2013
89.34
-1.082
-1.2%
Ranking of countries by current statistics by years


Comments: