29
/it/
it
AIzaSyAYiBZKx7MnpbEhh9jyipgxe19OcubqV5w
April 1, 2024
228291
Romania
ROU
true
2
1
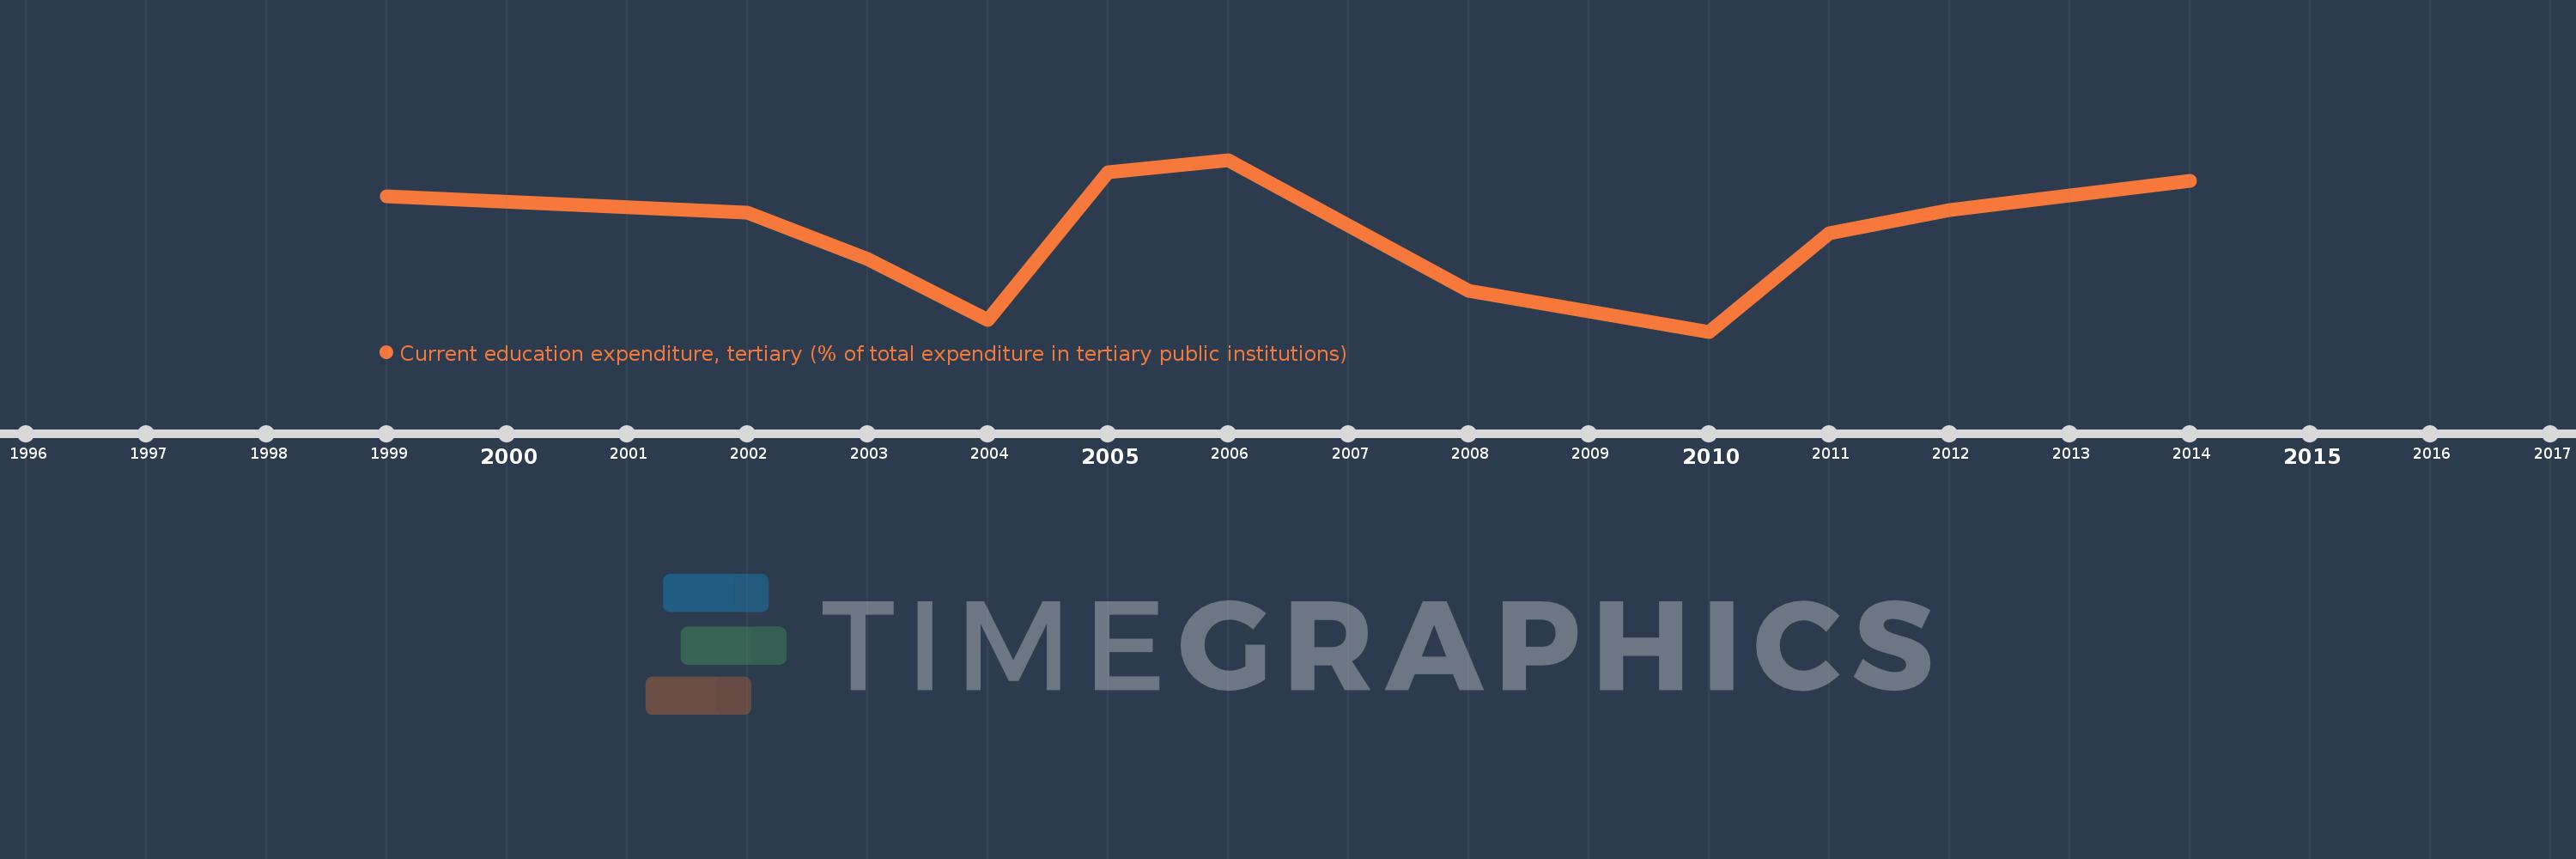
Current education expenditure, tertiary (% of total expenditure in tertiary public institutions)
2014,2013,2012,2011,2010,2008,2006,2005,2004,2003,2002,1999
Queste statistiche in altri paesi:
Linea del tempo:
Questa scala temporale mostra un grafico dal 1999 anno al 2014 anno. Romania. I dati fino ad 1998 anno non disponibili. Il numero di osservazioni attuali secondo i date: 12.
La fonte (nome):
Indicatori dello sviluppo mondiale
La fonte (organizzazione):
United Nations Educational, Scientific, and Cultural Organization (UNESCO) Institute for Statistics.
Categorie:
Education
sono stati aggiornati
23 apr 2017 anni
Indicatori delle variazioni dei valori per anni
Minima:
76.501
1 gen 2010 anni
Massimo:
92.483
1 gen 2006 anni
Alla data di osservazione
Valore
Variazione assoluta
La variazione rispetto al valore precedente
1 gen 1999 anni
89.107
+89.107
0.0%
1 gen 2002 anni
87.598
-1.509
-1.69%
1 gen 2003 anni
83.268
-4.329
-4.94%
1 gen 2004 anni
77.604
-5.664
-6.8%
1 gen 2005 anni
91.333
+13.729
17.69%
1 gen 2006 anni
92.483
+1.15
1.26%
1 gen 2008 anni
80.307
-12.176
-13.17%
1 gen 2010 anni
76.501
-3.806
-4.74%
1 gen 2011 anni
85.676
+9.175
11.99%
1 gen 2012 anni
87.774
+2.099
2.45%
1 gen 2013 anni
89.152
+1.378
1.57%
1 gen 2014 anni
90.563
+1.411
1.58%
Classificazione dei paesi secondo i statistiche attuali per anni


Commenti: