29
/it/
it
AIzaSyAYiBZKx7MnpbEhh9jyipgxe19OcubqV5w
April 1, 2024
257155
Switzerland
CHE
true
2
1
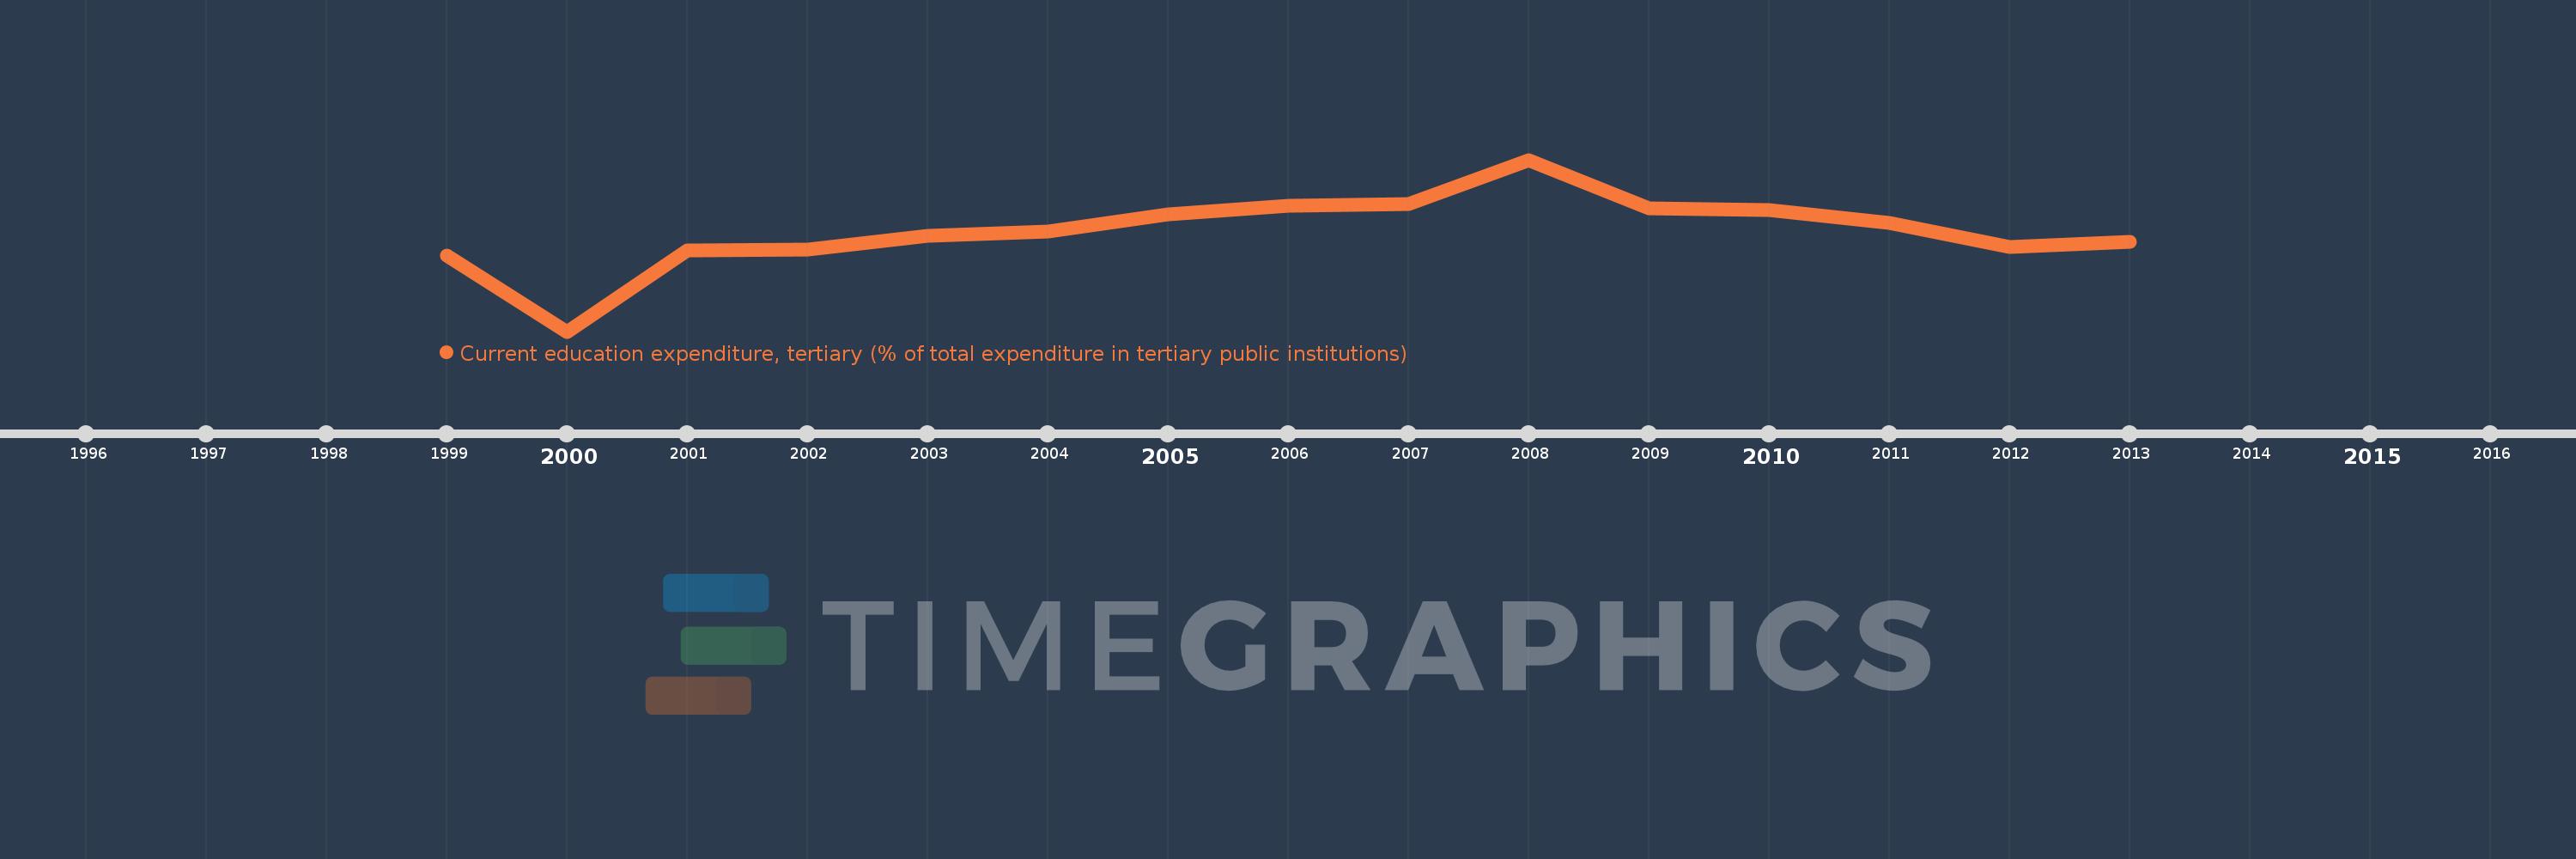
Current education expenditure, tertiary (% of total expenditure in tertiary public institutions)
2013,2012,2011,2010,2009,2008,2007,2006,2005,2004,2003,2002,2001,2000,1999
Queste statistiche in altri paesi:
Linea del tempo:
Questa scala temporale mostra un grafico dal 1999 anno al 2013 anno. Switzerland. I dati fino ad 1998 anno non disponibili. Il numero di osservazioni attuali secondo i date: 15.
La fonte (nome):
Indicatori dello sviluppo mondiale
La fonte (organizzazione):
United Nations Educational, Scientific, and Cultural Organization (UNESCO) Institute for Statistics.
Categorie:
Education
sono stati aggiornati
23 apr 2017 anni
Indicatori delle variazioni dei valori per anni
Minima:
83.235
1 gen 2000 anni
Massimo:
94.112
1 gen 2008 anni
Alla data di osservazione
Valore
Variazione assoluta
La variazione rispetto al valore precedente
1 gen 1999 anni
88.023
+88.023
0.0%
1 gen 2000 anni
83.235
-4.788
-5.44%
1 gen 2001 anni
88.382
+5.147
6.18%
1 gen 2002 anni
88.453
+0.071
0.08%
1 gen 2003 anni
89.274
+0.821
0.93%
1 gen 2004 anni
89.588
+0.313
0.35%
1 gen 2005 anni
90.672
+1.084
1.21%
1 gen 2006 anni
91.179
+0.508
0.56%
1 gen 2007 anni
91.313
+0.133
0.15%
1 gen 2008 anni
94.112
+2.799
3.07%
1 gen 2009 anni
91.052
-3.06
-3.25%
1 gen 2010 anni
90.912
-0.14
-0.15%
1 gen 2011 anni
90.096
-0.816
-0.9%
1 gen 2012 anni
88.613
-1.483
-1.65%
1 gen 2013 anni
88.925
+0.313
0.35%
Classificazione dei paesi secondo i statistiche attuali per anni


Commenti: