29
/it/
it
AIzaSyAYiBZKx7MnpbEhh9jyipgxe19OcubqV5w
April 1, 2024
42243
Latin America & Caribbean (excluding high income)
LAC
false
2
1
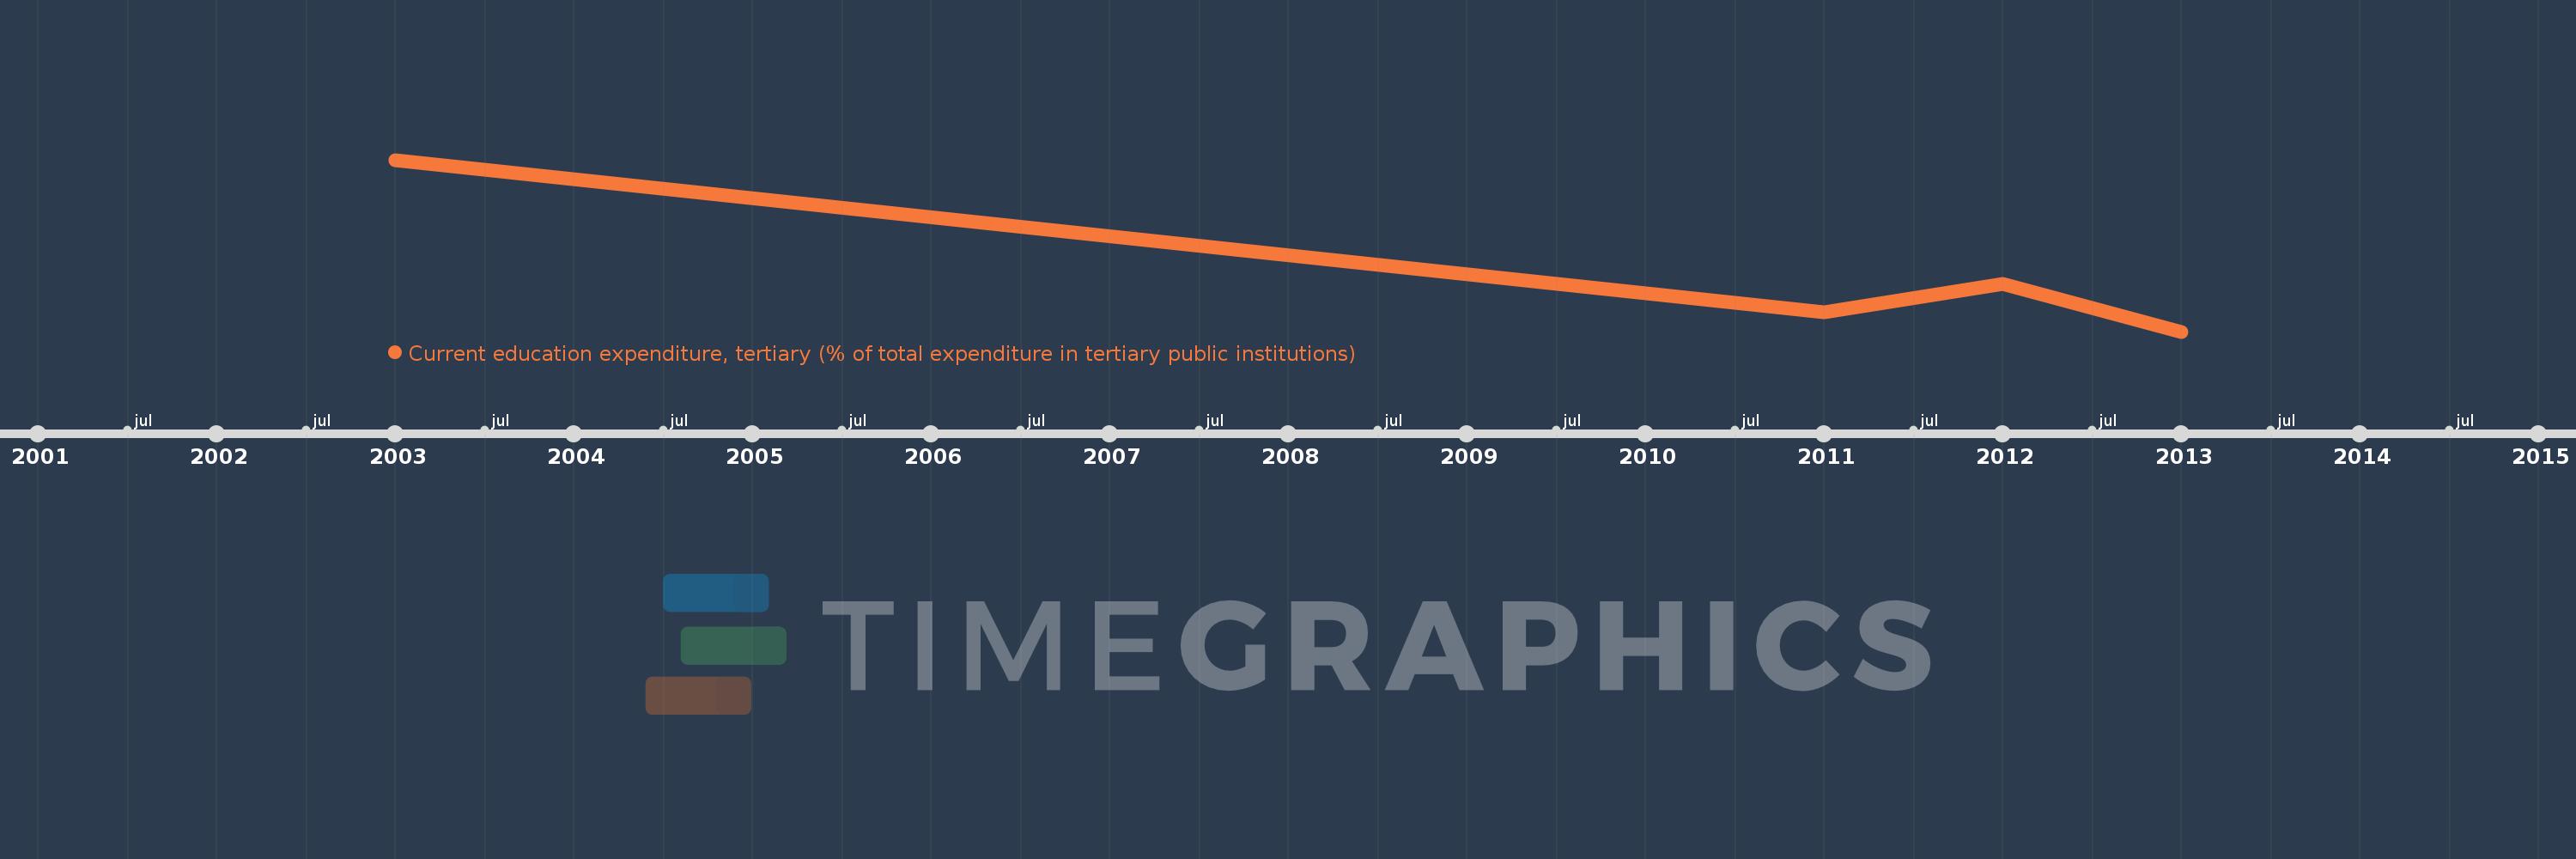
Current education expenditure, tertiary (% of total expenditure in tertiary public institutions)
2013,2012,2011,2003
Queste statistiche in altri paesi:
Linea del tempo:
Questa scala temporale mostra un grafico dal 2003 anno al 2013 anno. Latin America & Caribbean (excluding high income). I dati fino ad 2002 anno non disponibili. Il numero di osservazioni attuali secondo i date: 4.
La fonte (nome):
Indicatori dello sviluppo mondiale
La fonte (organizzazione):
United Nations Educational, Scientific, and Cultural Organization (UNESCO) Institute for Statistics.
Categorie:
Education
sono stati aggiornati
23 apr 2017 anni
Indicatori delle variazioni dei valori per anni
Minima:
88.482
1 gen 2013 anni
Massimo:
97.284
1 gen 2003 anni
Alla data di osservazione
Valore
Variazione assoluta
La variazione rispetto al valore precedente
1 gen 2003 anni
97.284
+97.284
0.0%
1 gen 2011 anni
89.485
-7.798
-8.02%
1 gen 2012 anni
90.911
+1.426
1.59%
1 gen 2013 anni
88.482
-2.43
-2.67%
Classificazione dei paesi secondo i statistiche attuali per anni


Commenti: