29
/es/
es
AIzaSyAYiBZKx7MnpbEhh9jyipgxe19OcubqV5w
April 1, 2024
42243
Latin America & Caribbean (excluding high income)
LAC
false
2
1
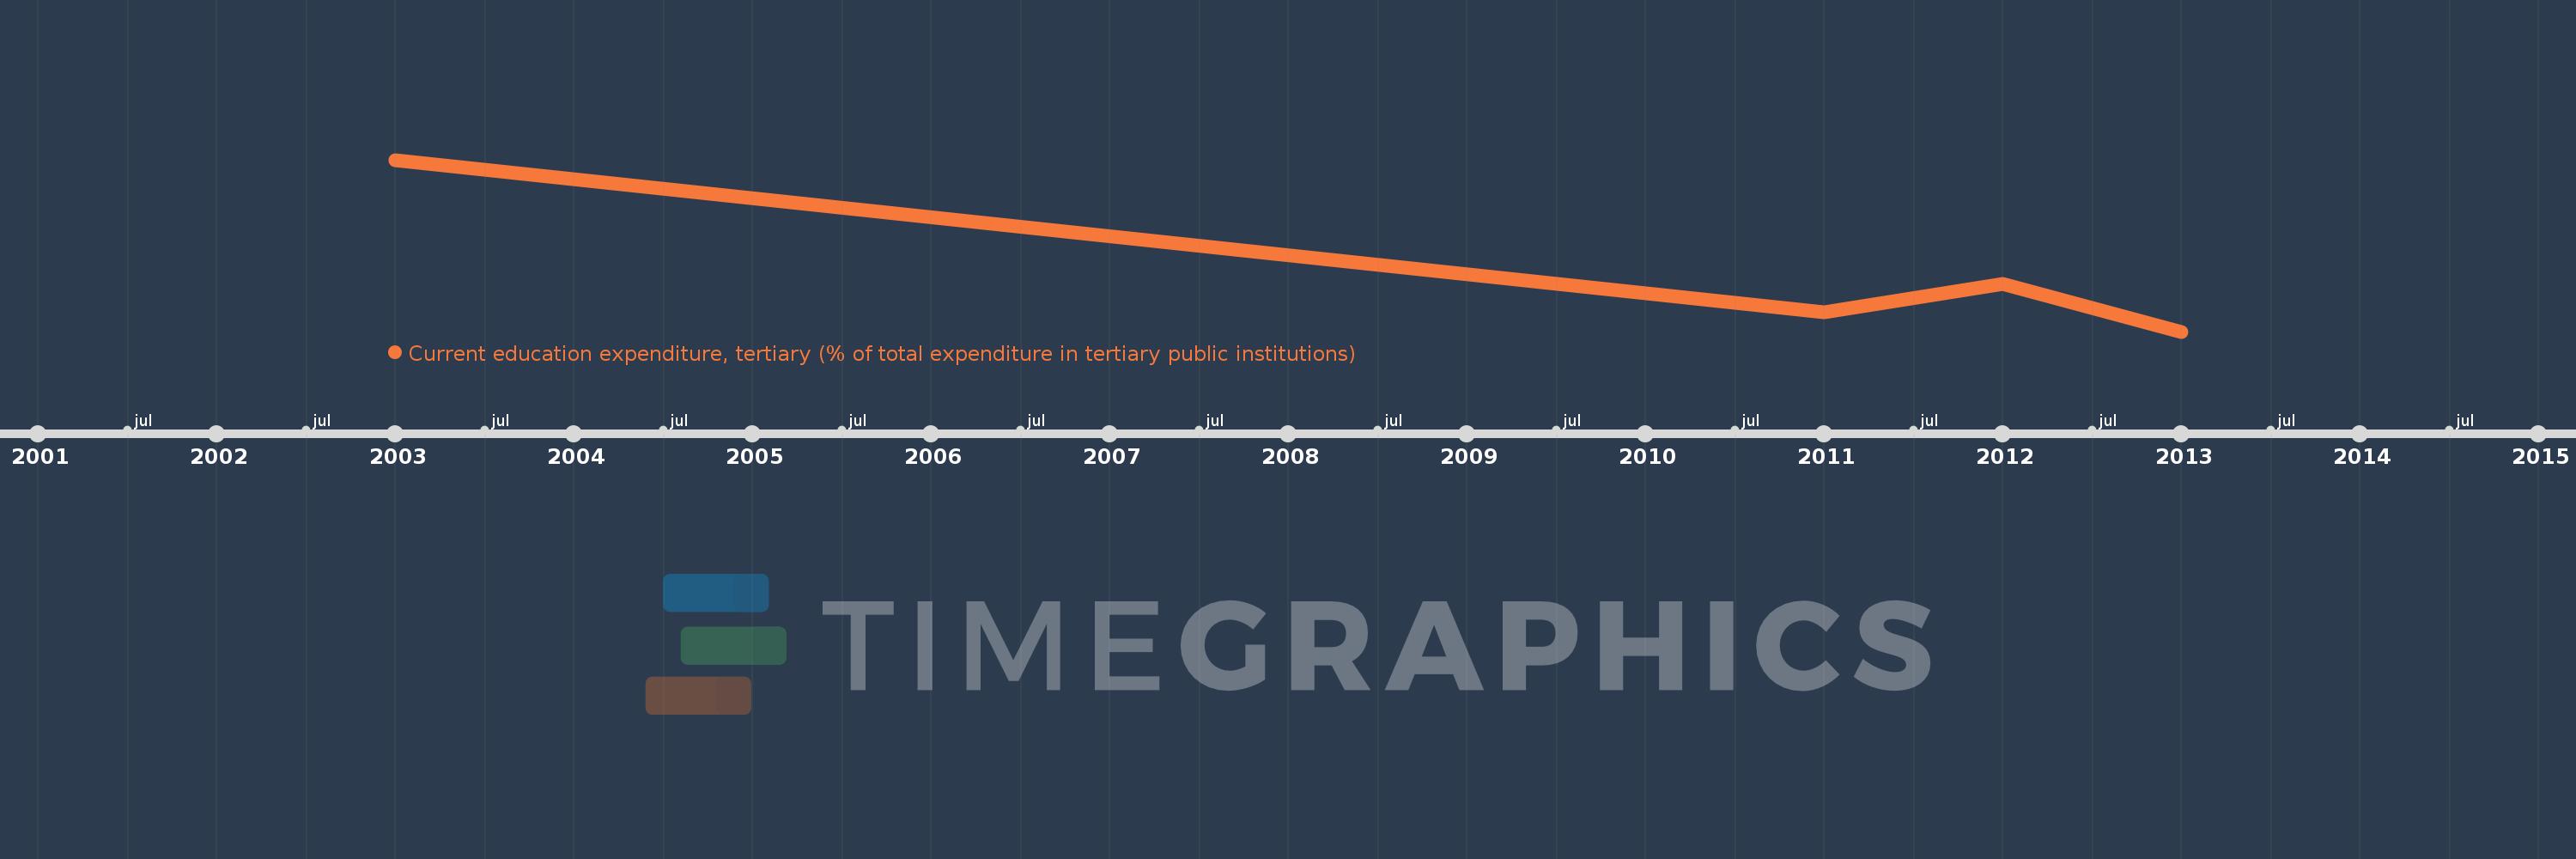
Current education expenditure, tertiary (% of total expenditure in tertiary public institutions)
2013,2012,2011,2003
Estas estadísticas en otros países:
línea de tiempo (timeline):
En esta escala de tiempo se presenta un gráfico de 2003 y 2013 de Latin America & Caribbean (excluding high income). Los datos de 2002 están ausentes. El número de observaciones reales por fecha: 4.
Fuente (nombre):
Indicadores del desarrollo mundial
Fuente (organización):
United Nations Educational, Scientific, and Cultural Organization (UNESCO) Institute for Statistics.
Categorías:
Education
Se ha actualizado:
23 abr 2017 año
Los indicadores de los cambios de valor en los últimos años
Mínimo:
88.482
1 ene 2013 año
Máximo:
97.284
1 ene 2003 año
A la fecha de observación
Valor
Cambio absoluto
El cambio con respecto al valor anterior
1 ene 2003 año
97.284
+97.284
0.0%
1 ene 2011 año
89.485
-7.798
-8.02%
1 ene 2012 año
90.911
+1.426
1.59%
1 ene 2013 año
88.482
-2.43
-2.67%
Ranking de los países por los datos estadísticos actuales


Comentarios: