29
/es/
es
AIzaSyAYiBZKx7MnpbEhh9jyipgxe19OcubqV5w
April 1, 2024
29748
Euro area
EMU
false
2
1
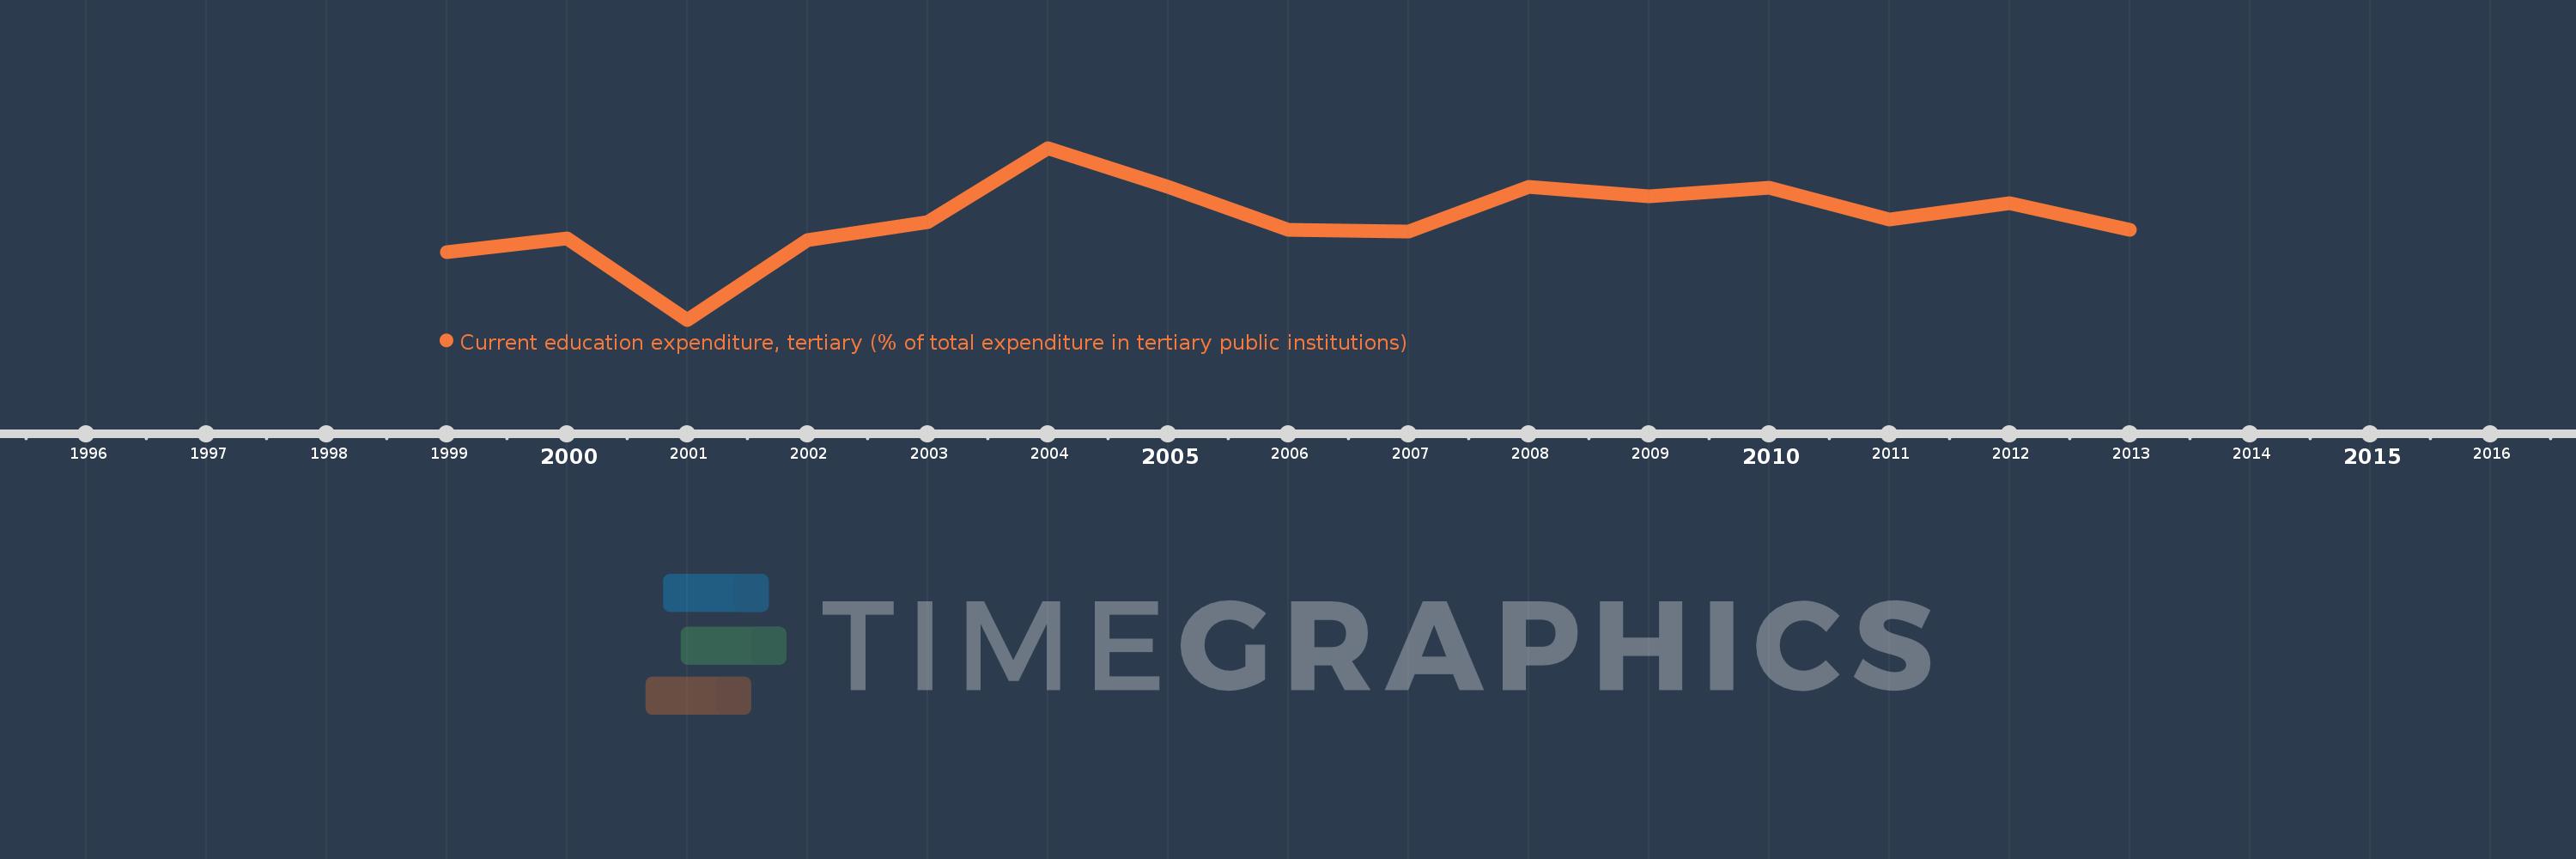
Current education expenditure, tertiary (% of total expenditure in tertiary public institutions)
2013,2012,2011,2010,2009,2008,2007,2006,2005,2004,2003,2002,2001,2000,1999
Estas estadísticas en otros países:
línea de tiempo (timeline):
En esta escala de tiempo se presenta un gráfico de 1999 y 2013 de Euro area. Los datos de 1998 están ausentes. El número de observaciones reales por fecha: 15.
Fuente (nombre):
Indicadores del desarrollo mundial
Fuente (organización):
United Nations Educational, Scientific, and Cultural Organization (UNESCO) Institute for Statistics.
Categorías:
Education
Se ha actualizado:
23 abr 2017 año
Los indicadores de los cambios de valor en los últimos años
Mínimo:
85.667
1 ene 2001 año
Máximo:
92.691
1 ene 2004 año
A la fecha de observación
Valor
Cambio absoluto
El cambio con respecto al valor anterior
1 ene 1999 año
88.438
+88.438
0.0%
1 ene 2000 año
89.002
+0.564
0.64%
1 ene 2001 año
85.667
-3.335
-3.75%
1 ene 2002 año
88.911
+3.244
3.79%
1 ene 2003 año
89.667
+0.756
0.85%
1 ene 2004 año
92.691
+3.024
3.37%
1 ene 2005 año
91.105
-1.586
-1.71%
1 ene 2006 año
89.351
-1.754
-1.93%
1 ene 2007 año
89.269
-0.082
-0.09%
1 ene 2008 año
91.114
+1.844
2.07%
1 ene 2009 año
90.718
-0.395
-0.43%
1 ene 2010 año
91.076
+0.358
0.39%
1 ene 2011 año
89.77
-1.307
-1.43%
1 ene 2012 año
90.422
+0.653
0.73%
1 ene 2013 año
89.34
-1.082
-1.2%
Ranking de los países por los datos estadísticos actuales


Comentarios: