29
/es/
es
AIzaSyAYiBZKx7MnpbEhh9jyipgxe19OcubqV5w
April 1, 2024
276494
United States
USA
true
2
1
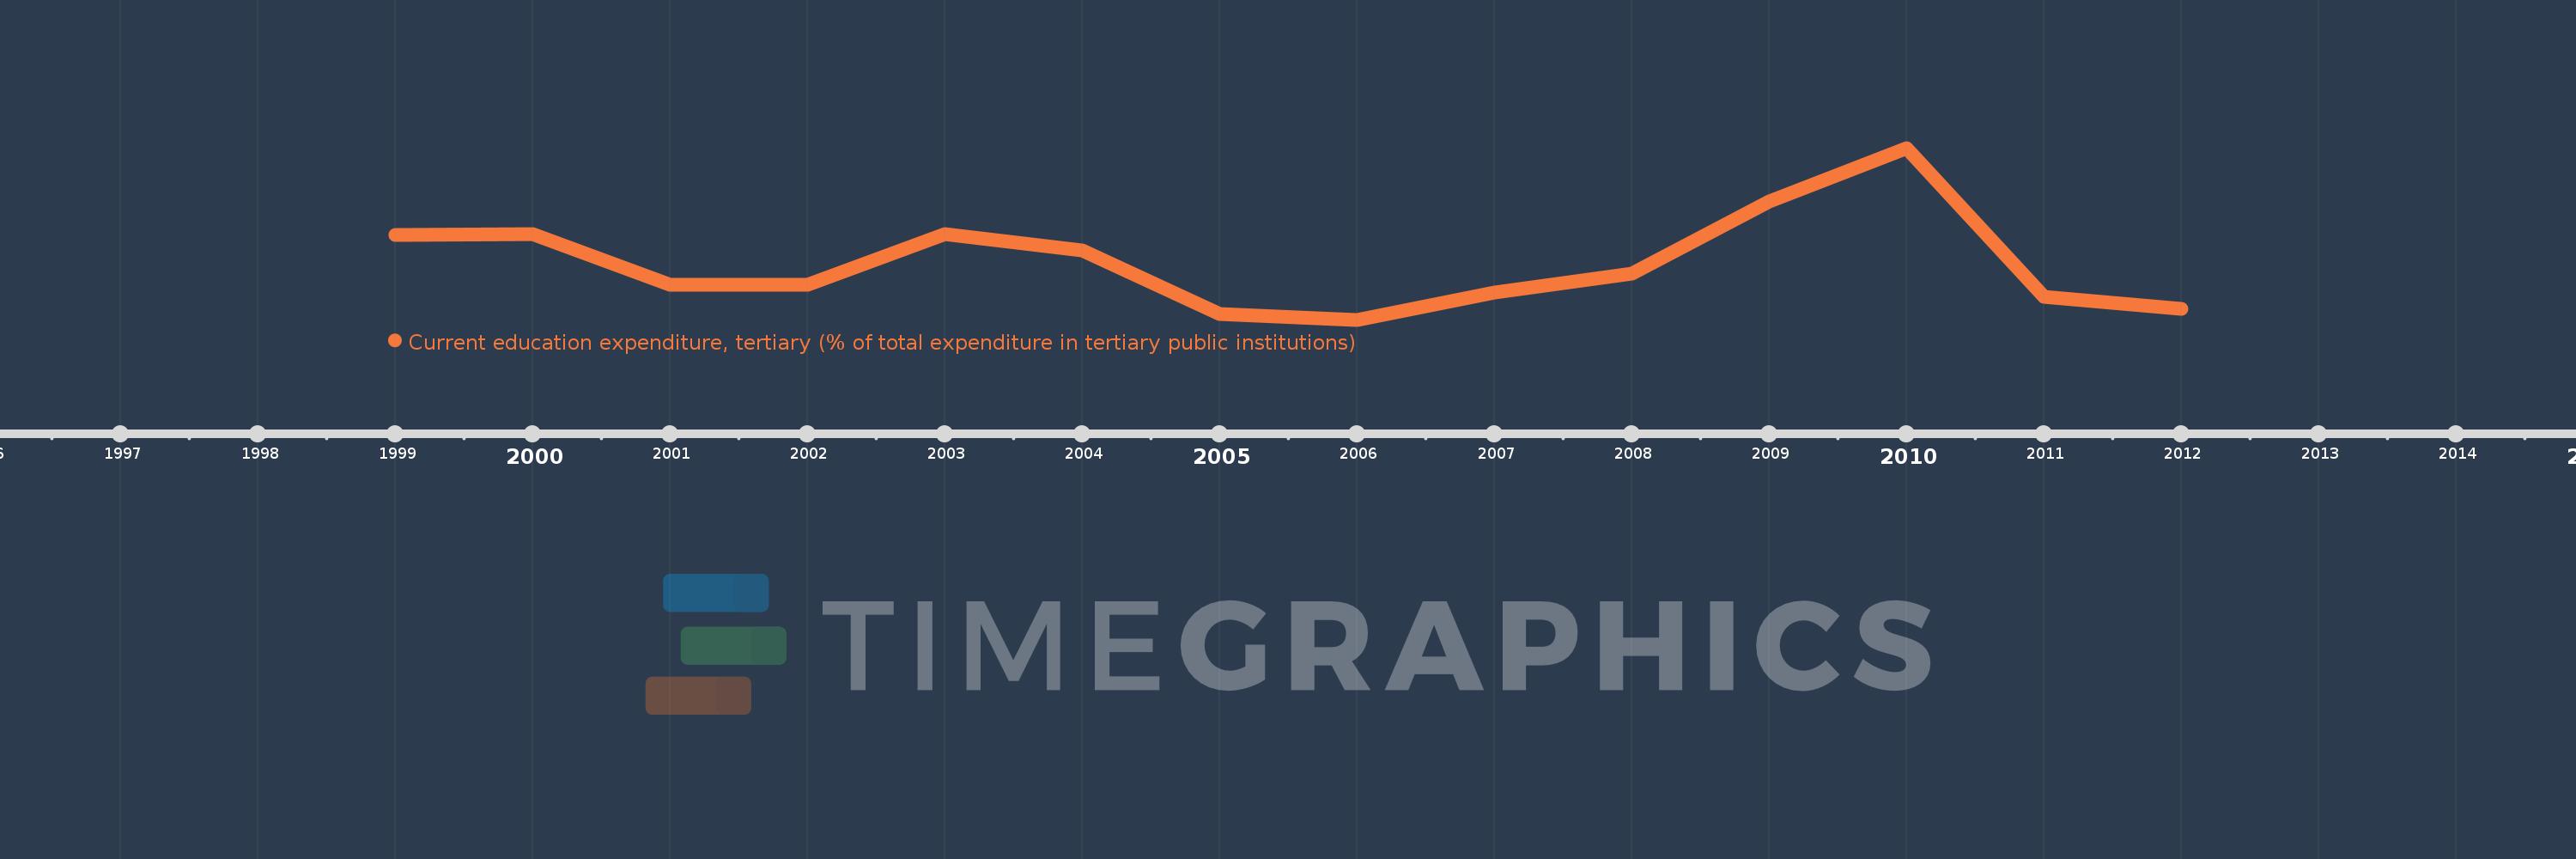
Current education expenditure, tertiary (% of total expenditure in tertiary public institutions)
2012,2011,2010,2009,2008,2007,2006,2005,2004,2003,2002,2001,2000,1999
Estas estadísticas en otros países:
línea de tiempo (timeline):
En esta escala de tiempo se presenta un gráfico de 1999 y 2012 de United States. Los datos de 1998 están ausentes. El número de observaciones reales por fecha: 14.
Fuente (nombre):
Indicadores del desarrollo mundial
Fuente (organización):
United Nations Educational, Scientific, and Cultural Organization (UNESCO) Institute for Statistics.
Categorías:
Education
Se ha actualizado:
23 abr 2017 año
Los indicadores de los cambios de valor en los últimos años
Mínimo:
88.426
1 ene 2006 año
Máximo:
93.077
1 ene 2010 año
A la fecha de observación
Valor
Cambio absoluto
El cambio con respecto al valor anterior
1 ene 1999 año
90.726
+90.726
0.0%
1 ene 2000 año
90.742
+0.017
0.02%
1 ene 2001 año
89.361
-1.381
-1.52%
1 ene 2002 año
89.361
0.0
0.0%
1 ene 2003 año
90.736
+1.375
1.54%
1 ene 2004 año
90.297
-0.44
-0.48%
1 ene 2005 año
88.575
-1.722
-1.91%
1 ene 2006 año
88.426
-0.148
-0.17%
1 ene 2007 año
89.172
+0.746
0.84%
1 ene 2008 año
89.673
+0.501
0.56%
1 ene 2009 año
91.631
+1.958
2.18%
1 ene 2010 año
93.077
+1.446
1.58%
1 ene 2011 año
89.05
-4.027
-4.33%
1 ene 2012 año
88.73
-0.319
-0.36%
Ranking de los países por los datos estadísticos actuales


Comentarios: