29
/es/
es
AIzaSyAYiBZKx7MnpbEhh9jyipgxe19OcubqV5w
April 1, 2024
33321
European Union
EUU
false
2
1
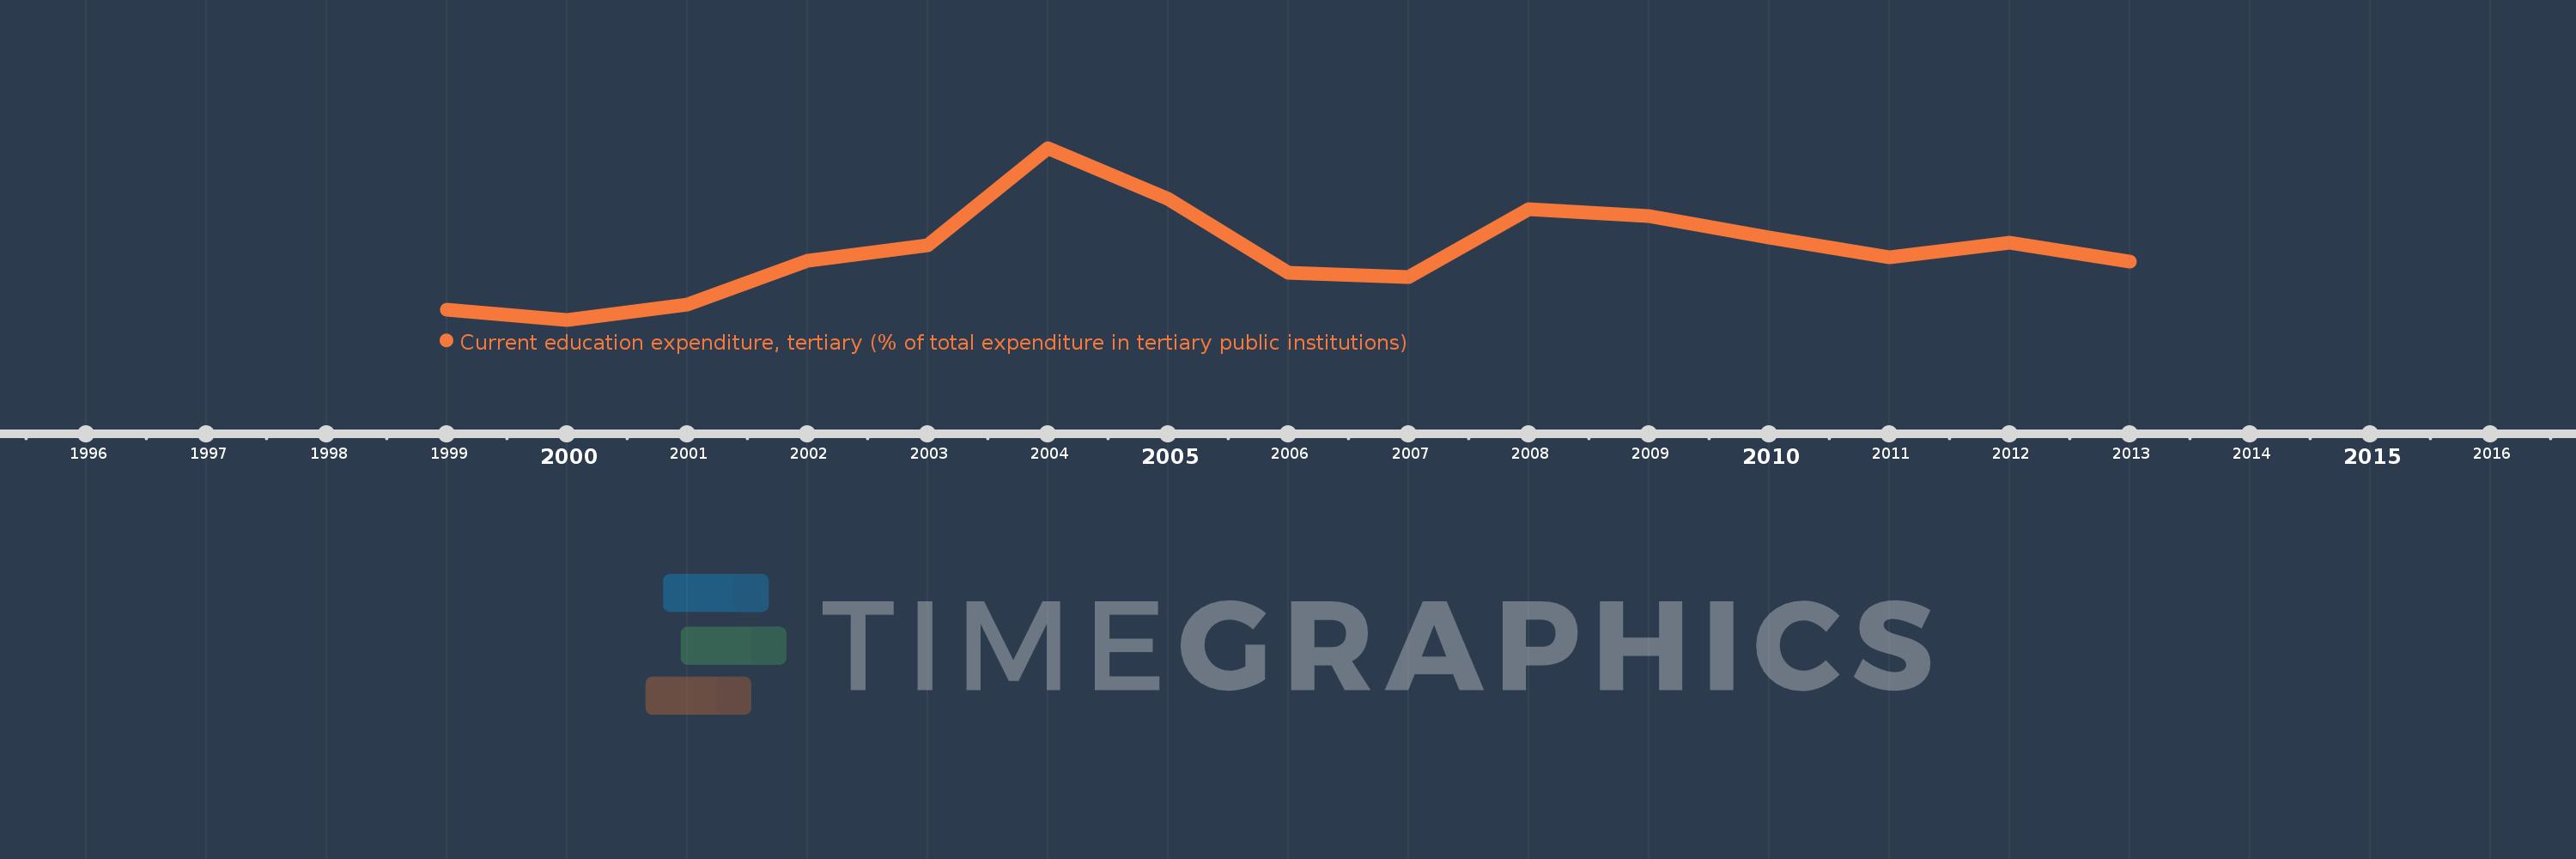
Current education expenditure, tertiary (% of total expenditure in tertiary public institutions)
2013,2012,2011,2010,2009,2008,2007,2006,2005,2004,2003,2002,2001,2000,1999
Estas estadísticas en otros países:
línea de tiempo (timeline):
En esta escala de tiempo se presenta un gráfico de 1999 y 2013 de European Union. Los datos de 1998 están ausentes. El número de observaciones reales por fecha: 15.
Fuente (nombre):
Indicadores del desarrollo mundial
Fuente (organización):
United Nations Educational, Scientific, and Cultural Organization (UNESCO) Institute for Statistics.
Categorías:
Education
Se ha actualizado:
23 abr 2017 año
Los indicadores de los cambios de valor en los últimos años
Mínimo:
88.099
1 ene 2000 año
Máximo:
92.691
1 ene 2004 año
A la fecha de observación
Valor
Cambio absoluto
El cambio con respecto al valor anterior
1 ene 1999 año
88.369
+88.369
0.0%
1 ene 2000 año
88.099
-0.269
-0.3%
1 ene 2001 año
88.507
+0.408
0.46%
1 ene 2002 año
89.684
+1.176
1.33%
1 ene 2003 año
90.083
+0.399
0.44%
1 ene 2004 año
92.691
+2.609
2.9%
1 ene 2005 año
91.333
-1.358
-1.47%
1 ene 2006 año
89.347
-1.986
-2.17%
1 ene 2007 año
89.232
-0.115
-0.13%
1 ene 2008 año
91.065
+1.833
2.05%
1 ene 2009 año
90.87
-0.195
-0.21%
1 ene 2010 año
90.296
-0.574
-0.63%
1 ene 2011 año
89.77
-0.526
-0.58%
1 ene 2012 año
90.161
+0.391
0.44%
1 ene 2013 año
89.658
-0.502
-0.56%
Ranking de los países por los datos estadísticos actuales


Comentarios: